Showing posts with label great depression. Show all posts

Sunday, May 3, 2020

May 2020 - Is the Bear Market Rally Over?

When we discussed whether 2020 might be the Great Depression of 1929 All Over Again on March 22, 2020, we applied the monthly Dow Jones chart variations of 1929 to the chart 2020 and noticed there may be a rebound soon.
2020 Redux of 1929 Dow Jones chart

and the market indeed started to rally almost immediately, then we thought we might get back to around 23,000 points by May/June, and plateau there for a while...

We've gone beyond that level to almost 25,000 now as shown by the 3-month daily until May 1st. So it might be a good time checking out technicals again, as we all know fundamentals look horrible.


The red line above corresponds to the 61.8% Fibonacci retracement, a bearish technical indicator that could indicate the bear market rally may be over, and we may at least re-test the low.


If we look at the 14-day relative strength index (RSI-14), we can see a top at 59.76 on April 29, not quite oversold just yet, but close to the level we were on February 18, 2020 top (RSI-14 = ~65).


Individual investors are not overly bullish and stay bearing on aggregate with a -13.43% bull-bear spread, which means this rally may last a bit longer.


In "normal times", I'd have no problem shorting this market, but with Central bank involvement we simply don't know where's it's going. The BOJ (Bank of Japan) has been printing money for years, and it has not helped their market a bit, but if we turn our eyes on Venezuela, and the Caracas market, money printing does work... when it comes to boosting the stock market.

That's over ten times return on investment over one year, and 210.94% since the beginning of 2020 in local currency... But the Venezuelan BolĂ­var crashed compared to the US Dollar, and the country is suffering from hyperinflation, something that's highly unlikely in developed economies in the short term, but not completely impossible over the long term depending on central banks actions.

We still favor "sell in May and go away" for the S&P 500, Dow Jones, and most markets around the world.


Sunday, March 29, 2020

How Long Will the COVID-19 Response Impact the Economy?

COVID-19 pandemic and its public policy response have caused a massive drop in economic activity. It's a given that Q1 and Q2 GDP numbers will be negative worldwide, but what can we expect going forward?

One way to look a the future is to check how China is doing to far since they were the first impacted and based on data coming from the government managed to contain SARS-CoV-2 virus by the end of February 2020.

COVID-19 Cases in China
This was achieved thanks to draconian lockdown measures, including locking persons suspected to be infected into their home. Shanghai stock market did drop by around 10 percent during Chinese New Year but quickly recovered, until it become clear COVID-19 would have a serious impact all around the world.

The PMI dropped sharply in February to 35.70 points, but we still have to wait longer to know the extent of the rebound in March and April.


Many businesses have re-opened, and while Hubei province has recently re-opened its borders (March 28), neighboring provinces are still wary of letting people travel. We also have contact in China, that non-essential business (e.g. entertainment) will not re-open until the end of April, and that's in Liaoning far from the epicenter in Wuhan. So in China, it's quite possible the local economy returns to normal in May. It would have been 4 full months since the beginning of the spread of the disease. However, China's GDP will certainly be impacted by the drop of activity in the rest of the world that is around 1.5 months behind in terms of cases.

My best-case scenario where the virus is contained around the world as fast as it was in China is that activity returns to "normal", yet somewhat lower levels, in July 2020. That would mean a sharply higher quarter-on-quarter Q3 GDP (worldwide), but still fairly lower year-on-year.

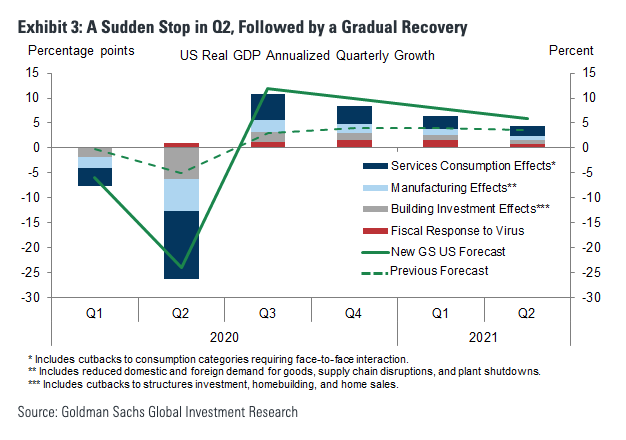
This assumes somehow few businesses and consumers bankruptcies, not currency crisis following helicopter money from central banks, or any other major financial issues related to the COVID-19 shutdown. How likely is that I'm not so sure, but this was the view of Goldman Sachs around a week ago with a 24% GDP drop in Q2 in the US, followed by +10% in Q3, and +8% in Q4 with the full year down 3.8%.


That would be a short recession, but considering how the US stock market was extended in February 2020 (and still is), problems are likely to linger much longer in the US, and many other countries.

Viruses are also interesting creatures, and earlier this month, we tried to look at the 1918-1919 Spanish flu to understand the economic and market impact of the novel Coronavirus, and we posted this chart representing the numbers of death per 100,000 in the UK at the time.

Viruses come in waves. It started in June-July 1918, then dropped until around early October, before coming back with a vengeance until the end of December with a small retrieve in January, before the last wave topping in in March 1919 before ending at the end of May 1919.

If this pattern occurred again that would be mean on and off lockdowns over a 10+ month period in each country, meaning nearly 12 months of lower economic activity worldwide, and the greatest depression we've ever seen. I have no clear idea what the world would look like in that case but there would be a low economic activity, out of control money printing, resulting in inflation down the road especially if they keep giving money directly to citizens also called MMT (Modern Monetary Theory) leading to the inflationary depression touted by Peter Schiff, at least in the US and the western world.

How will it exactly pan out? We just don't know, nor does anybody and only time will tell, but everybody should be aware of the risks and prepare at best as they can.

Sunday, March 22, 2020

2020: The Great Depression of 1929 All Over Again?

Following the governments' responses to the threat posed by COVID-19, stock markets around the world have collapsed rapidly and entered bear markets. How does the 3-week drop compare to historical events in 1929 and 1987? Here's how
Source: ZeroHedge

As of March 20, the drop is faster and deeper than for the first 40 days of the crash of 1929, and faster, but not quite as bad (yet) that the crash of 1987. The October 1987 crash was a one-time event that did not affect the economy that much, but analysts expect some serious repercussions in the real economy with expectations of a 24% GDP contraction in the US and up to 12% worldwide in Q2 2020,

That's worse than the great depression, so we may expect similar results, especially we also started with an overvalued stock market. There's one important difference though: the policy response is now much different with central banks and government throwing money around like there's no tomorrow. This will likely not prevent deflation in the short term, but a long period of deflation is unlikely. With that out of the way, let's have a look at the chart of the Dow Jones index during 1929 and 1932 courtesy of MacroTrends.


I've marked the tops and bottom with respectively green and red dots. Bear in mind, this is a monthly chart so the data represents the end of month value, not the absolute tops or bottoms. The Dow Jones topped at 5686.69 in August 1929 before falling to 3572.79 points in November 1929, or a 37% drop in 3 months. It was followed by a bear market rally that topped at 4379.05 in March 1930, a 22.5% increase. Then the market "slowly" collapsed to 814.82 over the course of 2 years a massive collapse of around 82%. If counted from the top of 1929, the stock market dropped by 85.6%.

While I don't believe the exact same scenario will happen, let's see how low the Dow Jones would have to fall to match the same pattern as in 1929.

The Dow Jones reached a top of 29,551.42 in February 2020. A 37% drop over three months would mean a Dow Jones valued at around 18,600 in May 2020. We are almost there though after a little over three weeks with 19,173.98 points. So we may not have to wait that long for a dead cat bounce. With a percentage gain of 22.5% that would bring us to around 22,800 points in the next three to four months or May/June considering a rebound starting as early as March. Under our scenario, it may stay at this level for a while, and then for whatever reason (second wave of COVID-19?) collapse to depression levels by May/June 2022: That would be 4,104 points, even lower than the market low of 6,469.95 reached on March 6, 2009. Put it that way it does not seem as impossible. Is it likely? Maybe not, as it would mean all that money created out of thin air would go in other assets than the stock market. Charles Nenner has been forecasting a market bottom at 5,000 points based on his work on cycles so it's not so far off.

So I've created a virtual chart of the Dow Jones with the data points above, and a slightly compressed schedule with the bottoming occurring in December 2021.
Dow Jones Simulation - Jan 2020 - Dec 2021

 It's not a prediction, just a simulation of what the next two years would look like if the Global Great Depression of 2020 had indeed started, and would take a path similar to the great depression of 1929. Hopefully, it's all wrong. Note that during market bottoms, the Gold price historically happens to match the Dow Jones price, so it would be at over $4,000 per ounce in our scenario.