Showing posts with label etf. Show all posts

Sunday, August 23, 2020

GMO Forecast July 2020 - Emerging Value is the Only Game in Town

 GMO published their latest 7-year forecast for July 2020, and most asset classes have dismissal expected returns over the next seven years from US large stocks to emerging stocks and large and small international stocks. Let's not even get started with bonds that are just as bad.

While we would consider gold, silver and other so-called real assets to be a potentially good long term investments at this point in time, those are not tracked by GMO, but we've noticed one exception in GMO chart: Emerging value.

9.2% yearly returns over seven would be an excellent investment in those days and age, but as we can see GMO separates emerging and emerging value, so we can't just buy any emerging stocks trackers.

But what's a value stock exactly? Here's Investopedia definition:

A value stock is a security trading at a lower price than what the company’s performance may otherwise indicate. Investors in value stocks attempt to capitalize on inefficiencies in the market, since the price of the underlying equity may not match the company’s performance.

They are often opposed to Growth stocks, often referring to stocks in the Technology and Biotechnology sectors with very high P/E ratios.

 Investopedia main takeaways:

  • Common characteristics of value stocks include high dividend yield, low P/B ratio and/or a low P/E ratio.
  • A value stock typically has a bargain-price as investors see the company as unfavorable in the marketplace.
  • A value stock typically has an equity price lower than stock prices of companies in the same industry.

So value stocks may be dividend stocks with low price-to-book and low price-earning ratio. This includes utilities, banks, consumer staples, and some commodities producers.

So our best bet would be to find value stocks in undervalued emerging markets, which last time we looked included Russia, China, Turkey, Hungary, and South Korea. With Russia, it's easy as most stocks are value stocks, and we could just add a Russia ETF to our portfolio such as MSCI Russia Capped Index (3027.HK) in Hong Kong and VANECK VECTORS/RUSSIA ETF (RSX) in the US.

China is more complex since the stock indexes include highly priced technology company such as Tencent, Allibaba and Baidu. One such option is Value China ETF (3046.HK) whose top holdings include Chinese banks, real-estate companies and insurances.

All companies are listed in the Hong Kong stock market. Alternatively, there's also Value China A-Share ETF (3095 HK) with companies listed in China, and more of a Chinese consumers story with 35% Consumer Goods, 34% Financials.

Note that while Google Finance shows there's no dividend paid out, you'd get ~2% dividend paid out yearly.

I had more of a struggle finding a China value stock in North America, and one of the closest would be Horizons China High Dividend Yield Index ETF (HCN.TO) listed in Canada.

The funds distributed dividends every quarter. The current is 6.77% based on info from Yahoo Finance.

I will not look into Turkey due to geopolitical risks at the moment, nor the smaller Hungary market, and complete this post by checking out South Korea. If you want to invest in South Korea, there's limited choice when it comes to South Korea ETF, and most people will not be able to purchase stocks on the KOSPI exchange.

That means we'd have to accept getting some experience to technology stocks like Samsung Electronics (PE: 17.49, DY: 2.53%), Naver (PE: 64.40, DY: 0.12%),  or  SKHynix (PE:22.3, DY: 1.34%) through South Kora ETF such as iShares MSCI South Korea Index Fund (EWI). 


In any case, I'm uncomfortable purchasing stocks in the September-October months due to the high-valuation in the US stock market, and a stock market sell off in the US, may lead to a rise in the US dollars, and a sharp drop in emerging stock markets. If it does happen, it will certainly be an interesting buying opportunity. 


Sunday, February 23, 2020

The Case for Investing in Chinese Commodity Producers

Many asset classes around the world are overvalued right now, but I recently watched a video with Mike Maloney and Ronald-Peter Stöferle (of Incrementum AG) with the latter showing a chart we may be back to 2000 valuations for commodities.


The chart above represents the ratio between the SPGSCITR commodity index (aka S&P GSCI) against the S&P 500. It just shows stocks are really expensive compared to commodities.

And if we look at the long term chart of the GSCI commodity index courtesy of trading economics, commodities are indeed back to price not seen since the end of the 90's.

Great! Let's find a GSCI ETF tracker and we should get a nice return you may think. But not so fast, as you may remember commodity ETFs are usually terrible investments due to the contango effect. But let's double-check as in the US, there are two ETF's tracking GSCI: GSP and GSG.


Those are down around 70% since May 2016. The GSCI index is also down since that time, but only about 60%, It's not that bad considering the ~15 years time frame.

However, my brokers won't let me invest directly in ETF's in the US. So instead, I looked at mining stocks like BHP and Rio Tinto listed in the US.


While both stocks are well below their peals in 2006 or 2011, they have recovered a lot since the bottom in early 2016.

So I went looking for other opportunities in the Hong Kong stock market (Hang Seng). There aren't any commodity ETFs anymore apart from Gold based ones. So we can look at the charts, earnings, dividends and P/E of some of the commodity producers. It's always more risky to selecting individual stocks, especially those depressed, as they may go bankrupt, so I personally prefer to focus on larger companies.

Petrochina 0857.HK

We are back to the year 2014 price. The company is still making profits (0.33 HKD EPS), and paid a 4.6% dividend last September. With a one trillion market capitalization, it's one of the biggest companies in the world. There may be more downside, but patient investors will be rewarded by the dividend and potentially higher price in a few years.

Sinopec Shanghai Petrochemical Company Limited (0338.HK)


Sinopec is another large Chinese oil company back to 2014's prices. The dividend yield stands at 13.49% according to Yahoo (I suppose this will be revised down), and the company is still making a healthy 0.561 HKD profit per share. Market capitalization: 37.30 billion HKD.

China Coal Energy Company Limited (1898.HK)


Still a large (57 billion HKD) profitable (0.387 HKD per share) company, but probably more risky if the Chinese government really decides to scale down on coal-powered power plants. The company also pays a 3.28% dividend. The share price is really depressed well under the IPO price in 2006.

Sinofert Holdings Limited (0297.HK)

If you believe in the long term potential of agriculture, Sinofert looks promising. The company specializes in Potash which shot up in 2007/2008, and came down hard since then. The stock is really depressed at 0.80 HKD. But Sinofert is one of the largest fertilizer producers in China, is still making money (.075 HKD per share), and pays a dividend of 2.8%. The same could have been said in 2012 however, but the longer the undervaluation remains, the more the stock may gain when the market reassesses.

All those companies also have a price-to-book and price-to-sales well below 1, and they are very unlikely to go bankrupt. In the worst-case scenario, the stock price goes nowhere, but you still get paid to wait thanks to the dividend.

Do you know of any other HK listed commodity stocks that are paying dividends, depressed, and profitable? Let us know in the comments.


Friday, November 16, 2012

5 New "Jim Rogers" Commodities ETNs: RGRC, RGRA, RGRE, RGRP and RGRI

This week, Royal Bank of Scotland (RBS) has added five new ETNs to its offering, giving exposure to commodity indexes created by Jim Rogers:
  • RBS Rogers Enhanced Commodity ETN (RGRC)
  • RBS Rogers Enhanced Agriculture ETN (RGRA)
  • RBS Rogers Enhanced Energy ETN (RGRE)
  • RBS Rogers Enhanced Precious Metals ETN (RGRP)
  • RBS Rogers Enhanced Industrial Metals ETN (RGRI)
RGRA is the ETN equivalent to RJA ETF, RGRC is the equivalent of RJI ETF and RGRE is equivalent to RJN. ETN and ETF are structured differently, but I assume the 3 new products I've just mentionned should provide similar returns to the existing ETF, unless there are important ost differences between managing those 2 different types of financial products.

The real novelty is with RBS Rogers Enhanced Precious Metals ETN and RBS Rogers Enhanced Industrial Metals ETN, which as far as I know do not have equivalent ETF products.

Thursday, January 26, 2012

Baltic Dry Index Near All Time Low

The Baltic Dry Index (BDIY) now stands at 784 USD, basically at the lowest level it reached in November 2008 as you can see in the 5-year chart below.

This index tracks the price of shipping (by sea) and shows an oversupply of ships vs demand for shipping. I've seen some reports saying that this slump is due to the delivery of ships ordered during the boom in 2006/2007 to meet demand. There is indeed a long leadtime to manufacture large vessels. However, this indicator could still confirm the recession call by Hussmann and ECRI as well as a sharp correction for industrial commodities. I've also seen a 12-year chart that shows we are near all time lows.(Sorry I can't find it back).

Another metric for maritime traffic can be the Guggenheim Shipping ETF (SEA), composed of shipping companies. It has also been dropping sharply since February 2012 (-50% top to bottom), although it has stabilized during the last 4 months. The 2-year chart can be seen below.

Both the Baltic dry index and SEA ETF either indicate serious economic troubles ahead, or they have bottomed out and the SEA is a buying opportunity. I know where I stand at the moment...
I previously wrote about BDI in February 2011, as I was worried it would on industrial commodities. In retrospect, it would not have been a bad time to sell stocks and commodities.

Tuesday, December 20, 2011

Jim Rogers: North and South Korea may Merge Within 5 Years

Following the death of Kim Jong-il this week, Jim Rogers was asked his views on North Korea and South Korea. He expects them to merge within 5 years in what would make a strong Korea with cheap labor and natural resources in the North and good management in the South.


You can invest in South Korea via iShares MSCI South Korea Index (EWY) or IQ South Korea Small Cap ETF (SKOR). There is currently no easy to invest directly in North Korea, especially due to US restrictions on North Korea.

Saturday, November 19, 2011

8 Investment Ideas for 2012

2012 is coming soon, and we can start to consider some investments ides for next year.
2012 is likely to be cursed with the same problem as 2011 with western debt crisis in Europe, the US, Great Britain and possibly Japan. As now, there will be a "fight" between market forces which want to liquidate the debt and the central banks & governments who want to print money to avoid deflation at all cost. There are also talks about a debt bubble in China, but their citizen and government have savings and reserve, so although they will suffer as well, they should be OK.

We know that the US, UK and Japanese central banks have done quantitative easing, and will probably do it again, although there is political pressure not to do so. The ECB has not (officially) done quantitative easing yet. The US and UK are in the worst possible position since both their government and citizens are heavily indebted and have trade deficits. The Japanese government has a lot of debt, but has a current account surplus and not much private debt. Europeans are in the middle.

In the next few years, peak oil (and peak everything) will also have a serious impact on your investment, so I'll also give some longer term investments ideas to try to preserve capital.

Here are eight investment ideas I have for 2012 in no particular order:
  1. Rice and agricultural commodities:

    I like rice for 2012 as last year, it has not performed very well and there is currently a global glut due to Indian rice production that largely offsets the issues due to the floods in south east Asia. For individuals investors, it relatively tricky to invest in Rice. For people who have access to the French stock market, you can buy RICEF PI OPENN (FR0010606509 - 1377N). Read Investing in Rice for other options and more details.

    Longer term, agricultural commodities should perform well due to rising global population, aging of farmers worldwide, reduction of arable land and possibly massive money printing by central banks.

    The good news is that there are plenty of options to invest in agricultural commodities via ETF such as DBA, RJA and ELEMENTS Rogers Intl Commodity Agri ETN (RJA), PowerShares DB Agriculture (DBA) and iPath DJ-UBS Agriculture TR Sub-Idx ETN (JJA). If you prefer agricultural stocks, you could invest in Market Vectors Agribusiness ETF (MOO)

  2. Crude Oil

    This is both a short term and long term investment. Many pundits explain that today, oil costs around 70 USD per barrel to produce. For 2012, if you see crude oil (WTI) go below 70 USD, you can consider investing massively in the commodity, even though it may go much lower. In that case, production will slow considerably until prices go above 70 USD (and more) again.

    Since peak oil is inevitable and the IEA says reserves are declining by above 6% per year, so we'll have a supply problem even if the economy is in recession and demand collapses. A US military report also says that surplus may disappear in 2012, which serious shortage occurring in 2015.

    First, I'll explain how not to invest in crude oil namely United States Oil (USO), iPath S&P GSCI Crude Oil TR Index ETN (OIL) and the likes as they have an horrific decay and their target is zero after numerous reverse splits. I'm not kidding. If you invest in a commodity linked ETF always try to compare it with the tracked commodity for a period of at least 2 or 3 years. Actually, it does not hurt to do it for any ETF you plan to buy.

    Unless you have access to oil futures, it also difficult to invest in crude oil for individual investors and you cannot easily store the thing like you do with Gold and Silver. You invest in Crude oil (WTI and Brent) via ETF such as ELEMENTS Rogers Intl Commodity ETN (RJI) or a fund like Barclays Capital Funds - Global Commodities Deltafor Singapore/ Hong Kong investors. Those follow Jim Rogers commodity index, so they are composed of a basket of commodities and only 40% is actually invested in crude oil. If you have better alternative that do not involve buying an oil tanker, I'd appreciate.

    An alternative way to invest in commodities is to buy stocks in the middle east, for example via Market Vectors Gulf States Index ETF (MES).

  3. Gold and Silver Bullion and/or Coins

    Gold and Silver have had a tremendous run for the last 10 years, but as long as we have negative real interest over the world they should perform relatively well. Having said that, an 11 year bull market, with no negative year (for Gold) is not very common, so I would not be surprised if we have 1, 2 or 3 years where Gold does nothing. I would also not be surprised, if Gold and Silver become bubbles as the central banks print money to try to save the system. You can invest in gold via GLD or PHYS ETF and silver via SLV or PSLV. PHYS and PSLV are managed by Eric Sprott, so I'd trust those more than GLD and SLV. If you are afraid of default risk by third party, then simply buy physical Gold and Silver and store them at home. If you are a US citizen and are not afraid of default by your bank, google "celente mf global".

    Finally, gold stocks are cheap relative to gold bullion on an historical basis. You can read The case for Gold Miners vs Gold and Eric Sprott: Time to Buy Gold Stocks for details. Hong Kong investors may have to make their own Gold stock portfolio, see Hong Kong Gold Mining Stocks and Gold ETFs for a list of Gold stocks in the Hang Seng.

  4. US Natural Gas

    Over the last 5 years, US natural gas is down 39% (Source: Indexmundi) at 128.30 USD per 1000 m3 and at the same time, Russian natural gas is up 20% at 435 USD per 1000 m3 and Indonesian natural gas is up a whopping 160% at 377.22 USD per 1000 m3.

    Usually, commodities trade similarly over the world, but natural gas is different since it is difficult to transport. The reason for the decrease in the US is fracking, a technology breakthrough, which dramatically increased recoverable natural gas reserve in North America.

    This may not be an investment that rewards investors by 2012, but with such a large price difference between the US and the rest of the world, there will certainly be people who will work on liquified natural gas (LNG) and terminals are planned in the US.

    Once again commodity investing is difficult, and products such as UNG should be avoided like the plague. Actually, I could not find a proper way to invest in natural gas, except by buying natural gas stocks, please read Investing in Natural Gas for details. If you have ideas, let me know.

  5. Short long dated US Treasury Bonds

    If has been tried unsuccessfully over the years, so the timing is uncertain, but the fact that long dated US treasuries bonds will be much higher at some point in the future is a certainty.

    The US is the worst offender in term of debt: high government debt, high private debt, low saving rate and massive trade deficits. It can't get worse than that.

    The federal reserve is also committed to print money to avoid deflation at all cost, this means the US dollar will lose value and investors will sell their low yielding treasury bonds (10-year to 30-year) and find assets with better value.

    If you can't short treasury bonds directly, you can invest in TBF ETF, although it decays a bit you may be able to keep it a few years, contrary to TBT or TMV. Read How to short US treasuries for more information.

  6. Alternative Energies

    With peak oil and pressure against coal use due to climate change, alternative energy will have to be developed if we may to keep living a good life. Investments in solar, wind, (alternative) nuclear, cold fusion and more will be made and there will be a lot of failures, but it's likely some companies will have an amazing success. Alternative energy stocks are very depressed at those levels after the 2008 bubble.

    This is a long term investment (5 to 10 years) and 2012 may not be the right time, but who knows. Avoid investing directly in alternative energy stocks, as you are more likely to lose a lot of money and invest with ETF or mutual funds instead. Since we don't know which technology will prevail, I'd also avoid investing in Solar fund or Wind ETF independently, but rather find a funds that covers a broad range of alternative source. If I had a gun on my head, I'd rather invest in wind energy rather than solar energy, as the former has a better EROEI.

    Based on the comments above, you could invest in ETFs such as Market Vectors Glb Alternatve Energy ETF (GEX) or First Trust NASDAQ Cln Edge Smrt Grd Inf (GRID) as well as mutual funds such as BGF NEW ENERGY.

  7. Water

    Companies related to water such as water treatment, pipes and valves manufacturers... will benefit of the water issues around the world. For example, I can feel some investments are needed in the water infrastructure in Thailand and with climate change and rising population, better water management is needed for agriculture.

    This is also a long term investment and unlikely to pay off immediatly in 2012 but you can invest with PowerShares Water Resources (PHO) and PowerShares Global Water (PIO) , read Invest in Water with ETF for details.

  8. Buy the Euro

    This may seem counter-intuitive with all the bad press and talks about the end of the Euro, but the truth is Europe is trying to take care of its debt problem now and the ECB is reluctant to print more money to further help the indebted countries thanks to pressure from Germany.

    The US and UK central banks seem to be happy to print as needed, and the Japanese Yen seems overvalued as investors take refuge in this currency.
    So if you are a holder of US dollar, British pound or Japanese Yen you may consider buying Euros, especially if it seems the debt crisis is resolved, European government keep implementing austerity measures, private investors take their losses on bad investments and the European central bank is not involved in printing currency.

    The best way to safely (without leverage) invest in the Euro would be to open a fixed deposit in Euro if your bank/country allows it. If it is not possible, you could also invest in a currency ETF/ETN such as CurrencyShares Euro Trust (FXE) or iPath EUR/USD Exchange Rate ETN (ERO).

That's it for 2012 investment ideas. Do you agree with my choices? Do you have a different opinion? Please let me know in the comment section.

Tuesday, November 15, 2011

GMO 7 Year Asset Forecast Says Stay Away From Bonds

GMO has just released its monthly 7-year Asset Class Forecasts (November 2011).
Here are the expected annualized return (based on valuation and historical earning growth):

US Large caps: 1.8% per year
US Small caps: -0.4% per year
US High Quality: 5.4% per year
International Large caps: 5.8% per year
International Small caps: 4.6% per year
Emerging Markets: 5.6% per year

Different kinds of bonds are expected to return between -2.3% and 1.3% per year so that is all bonds are expected to return negative interests except emerging market bonds. Managed Timber is expected to return 6% per year.
Those are real returns adjusted for inflation of 2.5% per year.

You can receive GMO's forecasts (monthly) and the quarterly newsletter for free by registering at http://www.gmo.com

Friday, November 11, 2011

How to Invest in Water with ETF

Many emerging countries such as China and India have a large population and are growing rapidly. This put strains on water resources that are needed for agriculture and industry. Jim Rogers who is a well know long term bull on China, said the only thing he can think of that may change China success in the 21st century is if China does not manage its water issues properly.

It's not practical to store potable water as an investment and if you were able to do so, your government would probably seize it if there was a real water crisis. An easier way to invest in Water is to buy companies that provides pipes, valves and solutions to water treatment. You can invest via 2 ETF:

Investing in water companies is probably a long term bet (5 to 10 years or more) and you should probably not expect rapid gains, especially in the current environment.


Monday, October 31, 2011

Marc Faber November 2011 Market Commentary

Marc Faber has just released his November 2011 market commentary on his gloomboomdoom.com website.

This month report is entitled "The Strongest Principle of Economic Development Lies in Human Choices".

There are 2 attachments to the monthly market commentary (MMC) :
  • The Missing Chapter - A Personal View of Russia - Twenty Years After by Eric Kraus, Managing Director of Anyatta Capital
  • The Inflation Pulse Returns and Implications on the Fall Melt-Up of 2011 by Michael A. Gayed, Chief Investment Strategist at Pension Partners, LLC
The first attachment can be accessed at "The Missing Chapter - A Personal View of Russia - Twenty Years After" and you can download the PDF at the end of the linked article. In this chapter, Kraus discusses about Russia before the 1997 collapse and the corruption that took place at the time and how it has now improved and that Moscow feels the freest place in Europe.

The second attachment refers to "Inflation, Deflation And The Fall Melt-Up of 2011" article on Seeking Alpha where Mr. Gayed explains how to navigate the markets which consistently changing market sentiments from deflation to inflation fear and vice-versa. He uses the price ratio of the Treasury Inflation Protected Bond ETF (TIP) relative to nominal 7-10 Year Treasuries (IEF) to anticipate sentiment.

I'll try to post highlights of the Gloom Boom Doom market commentary a bit later.

Friday, October 28, 2011

Eric Sprott: Oil Price Must be over 75 USD for Production to Occur

Sprott Asset Management published their monthly newsletter Market at Glance (October 2011) entitled "Oil or Not, Here They Come".

First, they explain that oil has been mostly absent from recent financial headlines, but availability and price of crude oil remains a key factor in world growth:

While the recent clamor over EU solvency and weak global growth has temporarily displaced its media attention, oil’s crucial importance to the world economy has not dwindled in the slightest. Oil remains the world’s greatest single energy source today
...
By historical standards, the world has been coping with constrained oil production and high oil prices for most of the past six years. This tightness in oil supply has been a significant factor limiting global growth, and it would appear that no matter what financial solutions are eventually engineered by our politicians, global growth will remain significantly restricted by the real economy’s ability to produce oil. Limited global supply growth means that the Western world now faces significant competition for oil from emerging markets whose citizenry are willing to work much harder for far less. This will continue to result in a narrowing gap of per capita consumption between emerging and developed economies as the emerging economies continue to gain relative economic strength, wage growth, currency appreciation and purchasing power. We believe strategic investments in oil producers and service companies will offer an effective way to profit from this trend.
Then then mainly focus on the lack of oil production growth:
Global oil production has grown very little (since 2005), appreciating by a mere 2% in total production. This production plateau generated the 2008 oil price spike to nearly $150 per barrel. Subsequently, despite the economic stagnation experienced by developed economies, the price of Brent Crude Oil has averaged over $78 per barrel, four times higher than the ~$18 average that Brent traded at in the 1990s.

and that the International Energy Agency (IEA) and the U.S. Energy Information Administration (EIA) have had to consistently reduce their production forecasts over the years as you can see in the chart below with forecast for 2015 and 2020:

They also shows other charts with price forecast made in 2002 with price ranging between 15 to 30 USD (high price scenario) between 2002 and 2025, in 2009 they revised this with a price range of 50 to 200 USD. (2008 USD).

In the next section, they look at the causes of high oil price namely supply constraints, high production cost, middle east export are riskier and costlier and increased demand from emerging countries:

Supply Constraints.

First, and most importantly, global supply is struggling to grow because we are not finding and bringing into production any new "super giant" oilfields. This reality was well documented by the EIA in a study it published in 2008.3

The EIA study revealed that the largest 1% of oilfields (798 total fields) in the world account for over 50% of global production.

What has been discovered and brought into production in the past few decades are smaller fields, which normally have higher decline rates. As these new smaller fields replace production from larger fields, and older larger fields age, we can expect the global observed decline rate to increase from the current estimated rate of 6.7% (or 4.7 million barrels per day annually). 

High Production Costs.

Oil prices are also high due to rising production costs, and it’s worth noting that new production sources, such as offshore, tar sands and other unconventional sources are amongst the highest cost producers today... As a result, it is becoming clear to many industry analysts that current oil production cannot be sustained under $75 a barrel and the price required to sustain production seems destined to continually rise.

Middle East Exports are Increasing in Cost and Risk.

The so-called "Arab Spring" uprisings in countries such as Egypt and Libya are forcing these and other major oil producing nations to spend more of their oil revenue on social assistance programs. For example, as a result of newly announced social spending in Saudi Arabia, it is forecasted by The Institute of International Finance, Inc. that the budget balancing price of Saudi oil will jump from $68 per barrel in 2010 to $85 per barrel in 2011 and then continue to rise, but at a slower pace, to $110 per barrel by 2015.

Increased Demand from Emerging Markets.

As globalization continues, we can expect job growth to be higher in countries where the citizenry are willing to work harder for less. This roughly characterizes the emerging market countries which for the most part are also large exporters of goods and services, run significant trade surpluses and have strengthening currencies. These factors enable them to continue to increase their per capita and total oil consumption. Conversely, higher wage Western nations are fighting rising unemployment, trade deficits, weakening currencies and, consequently, are being forced to reduce their oil consumption.

They also spend a large part of the letter comparing the US and China in terms of economic growth and oil consumption.

To conclude, they recommend that western investors hedge themselves against declining purchasing power and oil consumption by buying oil producer and service companies:

For North American workers and investors, one way to hedge against a decline in living standards is to use your current relative advantage in oil purchasing power to accumulate oil reserves that will be developed in the future. This purchasing power advantage, currently evident in the time a worker in the West must work to earn a barrel of oil, will eventually dissipate, as world labour markets recalibrate and shift wealth from West to East....

The recent market decline and ongoing volatility is affording investors with an opportunity to invest in oil producers and service companies, in particular junior and mid-cap companies, at attractive valuations. Equities are pricing in much lower oil prices over the long-term. Our view is that while there may be additional volatility in the crude oil price in the short-term, long-term pricing will remain high and equity prices will rise to correct this disconnect.

You can subscribe to Sprott Asset management's Market at Glance newsletter free of charge or download the PDF version.

My take is that you although you can invest in oil producer such as Exxon, BP and the like, you could also invest in Oil Producing countries via Market Vectors Gulf States Index ETF (MES) for example. However, since supply will go down overtime, that means reserve of oil companies will also go down so this is a negative for such companies although crude oil price is likely to increase. Another way would be to invest in Crude Oil directly either buy buying commodities futures or ETF, but be careful which one you choose (e.g. avoid USO at all cost).

Wednesday, October 26, 2011

How to Short the CAC 40 (French Stock Market)

After an initial sell-off around the world, the market have slightly recovered. However the crisis is far from over. Let's see how we can short the CAC 40 (French Index) and try to time the short.

There are several ETF and funds to short the CAC 40 including:
  • Lyxor Etf Short Cac 40INSHC:PAR (in the US)
  • ELAN FRANCE INDICE BEAR (FR0000400434) (in France)
Let's see how both products fared against the CAC 40.

Lyxor ETF only started its quotation in March 2010. Between that time and today, the CAC 40 lost 17.62% while the ETF gained 1.93% (Source: Google Finance). Not really what we should expect. Bear in mind that this ETF is denominated in US dollar, so the exchange rate should also be taken into account.

ELAN FRANCE INDICE BEAR is older having started in 2002. After 9 years, the CAC 40 gained 3.19% where the mutual fund lost 44.49% (Source: Boursorama). Again not such a good performance, but decay over time is expected for such products. This is even worse if we take dividends into account.


So we should only use those products for relatively short period of time (a few months to 1-2 years) and timing is very critical.

Let's assume a 50% retracement (Fibonacci) of the recent fall.

The top was reached around 4160 (18 February 2011) and the bottom around 2780 (22 September 2011), so a 50% retracement would be around 3470. If we reach this level within1 or 2 months, the RSI-14 could also indicate the CAC 40 is overbought and could be a good starting point to start to short the French stock market.

Shorting (even through via ETF) is quite dangerous in the current environment since politicians always seem to find reasons to stimulate. So I may or may not start a position once the target level is reached.

Monday, October 10, 2011

GMO 7 Year Asset Class Forecast (Q3 2011)

GMO has just released its monthly 7-year Asset Class Forecasts and here are the expected annualized return (based on valuation and historical earning growth):
  • US Large caps: 3.1% per year
  • US Small caps: 1.5% per year
  • US High Quality: 6.6% per year
  • International Large caps: 7.2% per year
  • International Small caps: 6.0% per year
  • Emerging Markets: 7.2% per year
Different kinds of bonds are expected to return between -2.7% and 1.9% per year.
Managed Timber is expected to return 6% per year.
Those are real returns adjusted for inflation of 2.5% per year.

So the best performing assets should be international large caps (Europe & Japan?) and emerging markets and the worst performing assets should be US and international bonds.

One way to act on this forecast via ETF would be to buy iShares MSCI Japan Index Fund(EWJ), iShares S&P Europe 350 Index Fund (IEV) and iShares MSCI BRIC Index (BKF) on the long side, and buy short ETF for bonds such as ProShares Short 20+ Year Treasuries (TBF). If you can short, you could do so with SPDR Barclays Capital International Treasury Bonds (BWX).

You can receive GMO's forecasts (monthly) and the quarterly newsletter for free by registering at http://www.gmo.com

Friday, September 9, 2011

Marc Faber: Obama Irrelevant, Accumulate Gold

Marc Faber was on CNBC-TV18 (India) on the 9th of September 2011.

When asked about the Obama Job plan, he said it was mostly irrelevant as it is more of the same and the public deficit won't decrease.

He also gave his take on Bernanke and QE3 and said that quantitative easing was unlikely at the moment because the money supply (M1 I suppose) was growing very rapidly at the moment.

He would avoid industrial commodities at the moment and recommend Gold.

He expects the market to correct further around 1000 or below (S&P 500) even tough the current rally may last a bit further. Emerging markets would also fall as the US market corrects. So if he was heavily invested, he would lighten his positions if the rally goes further.

Since the interview was in India, he also talks about the Indian Stock market and that investors will a long time horizon (5 years and more) should invest in the Indian stock market, but that they should not expect 20% yearly return and that 5 to 8 percents per year would be more likely..

The last question was about currencies and he explained that the US dollar is probably better than the Euro at the current time, but that all paper currencies are not desirable before of negative interest rates and recommend to accumulate Gold as he could make the case that Gold is cheaper than when it was at 300 USD based on the increase in debt and monetary base.


If you want to invest in the Indian Stock market you could do so with iShares S&P India Nifty 50 Index (INDY) in the US among other or iShares BSE SENSEX India Index ETF (2836.HK) in Hong Kong

Wednesday, August 24, 2011

The case for Gold Miners vs Gold

Gold has been on a roll for many years but has especially gone up in a parabolic manner recently even though the expected correction seems now underway, actually a bit earlier than initially expected.

Gold miners have also gone up, but in no way as fast as the gold itself, as you can see from the 5-year chart below with SPDR Gold Trust (GLD) in Green , Market Vectors Gold Miners ETF (GDX) in Blue and AMEX GOLD BUGS INDEX (^HUI ) - the underlying tracked by GDX - in Red (Source: Yahoo Finance)


As you can see gold itself has clearly outperformed gold stocks in the last 5 years. Another important thing is that GDX tracks the HUI index pretty well. Whether an ETF can properly tracked the underlying index should be always be checked before investing in an ETF as some ETFs are poorly constructed and only designed to make money for their manager(s) or short term traders.

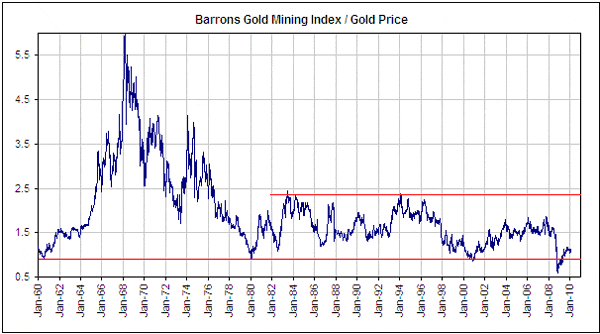
We can look back in history with the BMGI (Barron Gold Mining Index) to Gold price ratio and clearly see that relative to the price of Gold, Gold mining shares are historically still very cheap as you can see on the chart below (Source: 321gold.com).


This chart only shows the ratio until Q1 2010. In August 2011, the BMGI stands at 1394 and the Gold Price is around 1750 USD, so the ratio is around 0.80 which is close to historical lows (around the lower red line).

However, you can also notice that in early 80s, the ratio was also very low during the gold spike. That means that during the 1980 Gold bubble, Gold miners stocks did not go up as fast as gold either.

To conclude, if the current Gold bull market is not over, it could be a very good time to buy gold miner stocks. But if the Gold bull market is over, gold miners could still lose value albeit less than gold bullion.

Sunday, August 7, 2011

Physical ETF vs Synthetic ETF

The Hong Kong Exchanges and Clearing Limited provides a List of ETFs and Trading Arrangements of ETFs (Excel Format) that can be purchased on the Hong Kong stock market.

However, I noticed that they classified the ETFs in two categories:
  • Physical ETFs
  • Synthetic ETFs
So what's the differences between the two and the advantages and inconveniences of those types of ETF.

A Physical ETF simply owns the entities of an Index. For example, a physical ETF tracking the CAC 40 would simply hold shares of all 40 companies listed in this Index. The main advantage is that there is no counter-party risk, but should have to subtract cost and other inefficiencies to the ETF returns.

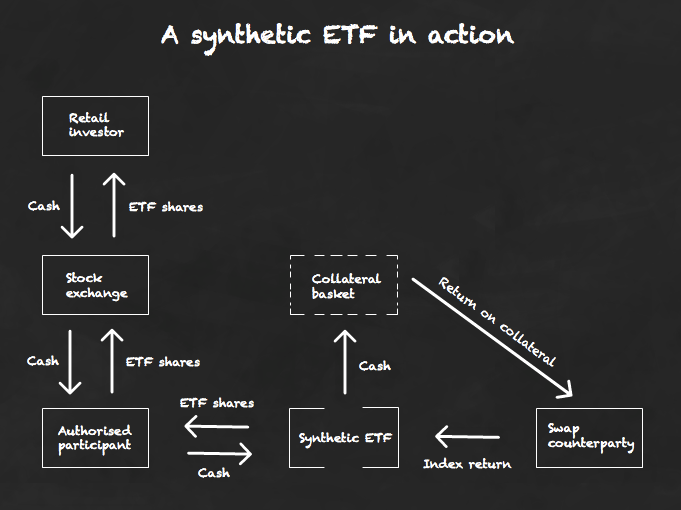
A Synthetic ETF is composed of total return swaps (financial derivatives) where a counter-party pays the exact return of the Index. Such products provides better returns since they allow to reduce the cost (reduce tracking errors) compared to the cost of physical ETF but they entail counter-party risk.

The diagram below explains how a Synthetic ETF actually works (Source: Moneyvator blog).

I recommend you read the following blog post if you need further details about Synthetic ETFs, especially to better understand the counter-party risks and understand what may happen if the swap provider goes bankrupt.

Thursday, August 4, 2011

Is the Stock Market fall over ?

I'll base my assessment of the same criteria I used in my previous blog post "Bearish Sign: Extreme Bullishness for US stock market" published on the 7th of April 2011.

Since that time, Investor Intelligence does not freely publish its Bull/Bear Ratio and you have to be a paying member to access this information (which I'm not). However, I found a study published on the 31st of July 2011 that makes use of this data (Up to 26 July).
So on the 26th of July, the bull bear ratio was around 2.3. It has certainly dropped below 2 since then considering the sharp decline in the S&P 500. But we can't really that to make a decision.

The 14-day Relative Strength Index (RSI) for the S&P 500 is about 24 , which is usually a sign of an oversold market at least in the short time.. However, notice that the S&P 500 (below) has broken the bullish trends it started in March 2009.

Finally, let's have a look on the percentage of stocks above their 200-day moving average.


23 percent of stocks are now above the 200 MA, this is a level not seen since the market crash of 2008, and could indicate stocks have not much further to drop.

To conclude, if you believe that central banks will come to the rescue (say Q3) if the market falls further (as Marc Faber does), this may be a pretty good time to buy stocks (in the US or abroad) or add to your positions. However, if they wait and see, the market could fall much more (before it goes up again) especially if advanced economies falls into recession or the long awaited slowdown of the Chinese economy materializes.

Thursday, April 7, 2011

Bearish Sign: Extreme Bullishness for US stock market

The latest Market Harmonics intelligence survey shows a Bull/Bear Ratio of 3.65, the highest ratio of the last 5 years.

See bull and bear charts here:
http://www.market-harmonics.com/free-charts/sentiment/investors_intelligence.htm

The 14-day Relative Strength Index (RSI) for the S&P 500 is around 60, if we pass the previous high of 1344 on the S&P500 with an RSI at 70 or over, it might be better to be prudent and decrease positions in stock that have outperformed worldwide, especially since the RSI has not gone below 30 since July 2010. Said that, we are not near the top of the channel we followed since March 2009.


Finally, I'll have a look on the percentage of stocks above their 200-day moving average with a chart from StockCharts.com for $nya200r.

Currently 83.70 percent of stocks are above the 200 MA, this is not extreme, but certainly does not encourage us to buy stocks especially this has been around 80 for a while.

To conclude, if the S&P 500 reaches a new high this month, it is most probably wise to sell part of your investment in stocks and possibly industrial commodities be it ETF or other financial instruments.

Wednesday, March 30, 2011

Jim Rogers Bought Japanese Stocks - 30 March 2011

Interview of Jim rogers on CNBC on 30th of March 2011, where he explains he bought Japanese stocks (mainly the index actually) this week and last week.

My Take: After Marc Faber and Mish Shedlock, Jim Rogers is also bullish on Japanese equities, probably a good way to convert his Yen holdings. After a 20-year bear market, relatively good valuations (PE: 15, PBV: 1), the next bull market in Japan may start soon although there are bad economic fundamentals such as a declining population and huge government debt. If you want to invest in Japan, you can do so via EWJ‎ (iShares MSCI Japan Index) in the US, 2814.HK in Hong Kong or FEDERAL INDICIEL JAPON P (FR0000987968) in France.


In the second part of the interview, he was asked about nuclear power which he believes will recover over time (several year) since we need nuclear power to replace oil and natural gas. He's also very bullish on oil due to declining reserves.
Concerning investing in Uranium, he is not rushing, but he's watching and may step in later on.


In the last and third part of the interview, they focus on Argentina with Slim Feriani who is very bullish on it, but Jim Rogers does not buy it at all even though Argentina has a lot of agriculture commodities.

Finally, he's also said he bought a bit of silver and gold last week, which surprised me since he generally does not buy at all time (or decades) high.

Thursday, March 24, 2011

China's Ghost Cities and Malls

SBS Dateline has a very interesting documentary about the Chinese real estate, the ghost cities to several part of china, the in-famous Dongguan mall (largest in the world) which is virtually empty, the ridiculous price of real estate that can not be possibly purchased by working people, and is only used as a store of value for the rich.

There are currently 64 millions vacant apartments in China where 160 millions people could live (assuming 2.5 persons / flat). Jim Chanos also previously said there is enough planned commercial real estate to provide a cubicle for every Chinese citizen.


Since China's real estate is not highly leveraged (50% down-payment requirements), there may not be a large collapse as in the U.S.A, but it's quite possible the number of transactions decrease dramatically, as sellers don't want to sell at loss and buyers do not want to over pay.


How can we take advantage of the coming real estate bubble burst in China?
First, the timing is very uncertain, as the Chinese government may be able to keep the game going for quite a while, so we'd have to find a financial product that does not decay over time.

One of the best way to invest in this is to short commodities themselves, commodities producers stocks and country index heavily relying on commodities such as Australia or Canada.

For most investors (including myself), it's quite difficult (and not really recommended) to short stocks and commodities. However, there are some short ETF leveraged or not. Please bear in mind that some ETF are not well structured and may make you lose money even if the underlying decreases in value (more on that in another blog entry).

Here's some ETF ideas to take advantage of the burst of the real estate bubble in China (I have not studied those in details, they are just starting points):

* PowerShares DB Commodity Dble Short ETN (DEE) - To short commodities. (Warning !!! It's leveraged) - http://finance.yahoo.com/q?s=dee
* ProShares UltraShort DJ-AIG Commodity ETF (CMD) - To short commodities. (Warning!!! it's leveraged) - http://finance.yahoo.com/q?s=CMD
* PowerShares DB Commodity Short ETN (DDP) - To short commodities - non leveraged -
http://finance.yahoo.com/q?s=ddp

Usually for short ETF, I wait for a few years to have an history to see how well they track the underlying index, as some as just going to go to zero (by design or incompetence).

I could not find any ETF to short Australian and/or Canadian stock indices.

Thursday, March 10, 2011

Has a top occured in Silver ?

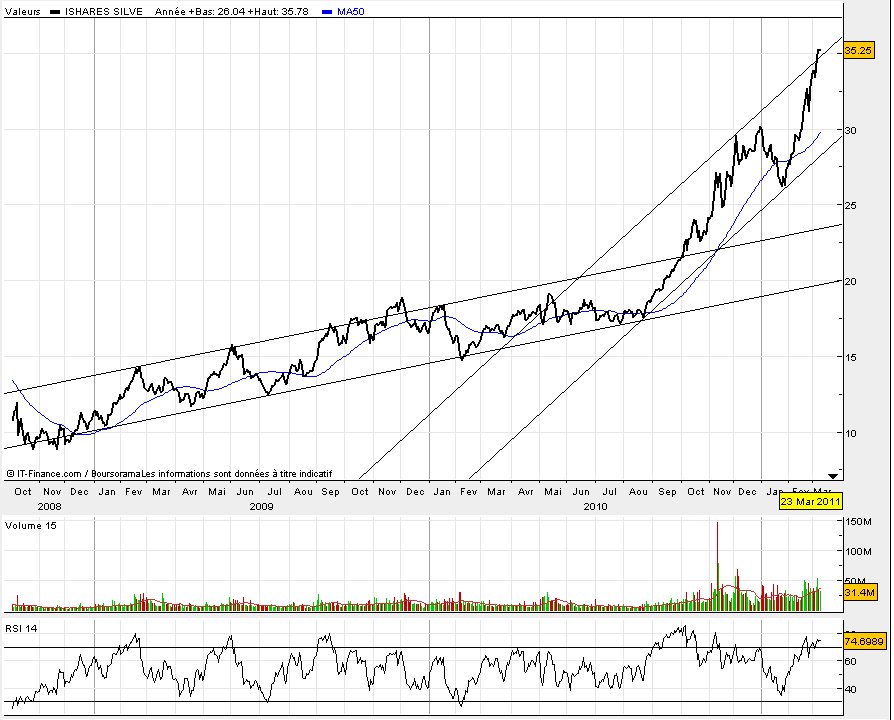
Silver has had quite a run especially since it's breakout last September and is up over 100% since that time. As long as we have negative real interest rates I do not really worry about the long term trend for silver. However, in the short term, silver had just hit to top of its recent ascending channel, the RSI 14 indicates it is oversold, and the RSI14 has not been in an oversold position since February 2010, although it was close to be during January 2011 correction. (See SLV ETF chart below, Source: Boursorama.com).

So unless we are right now in the final stage of silver bull market, we could expect a short term correction of silver to the lower band of the ascending channel close to 30 USD. I