When we asked whether the stock market rally was over on May 3rd, we noted the 1929 stock market rally took several months and our 1929 Redux simulation would take to it to May/June. We also pointed out one metric suggested it may have more legs: the AAII sentiment survey, or the bullishness/bearishness of the retail investor. We did not look into it too much at the time, so let's do that today by first looking at a 1998 to 2015 chart of the AAII bullishness 8-week moving average data courtesy of investing.com.

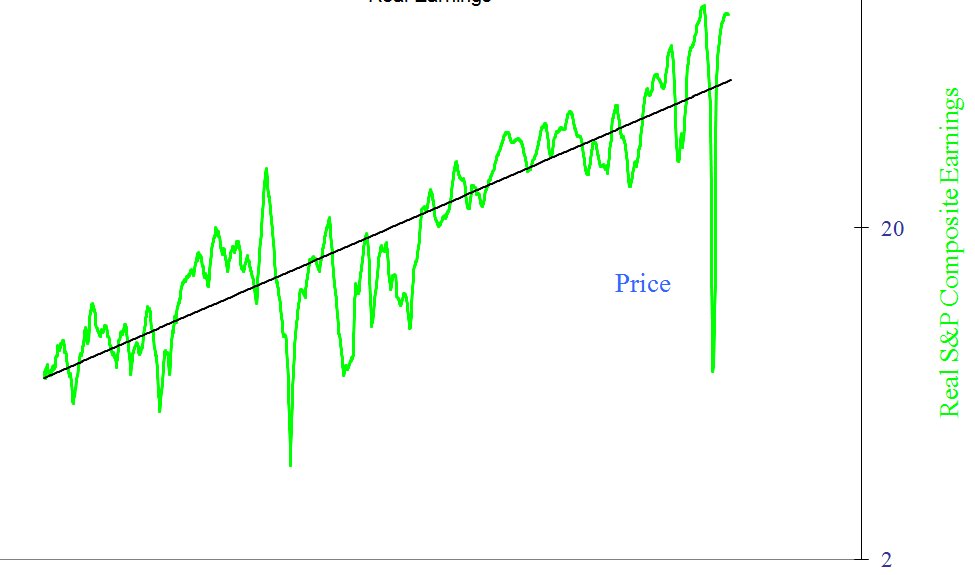
We can see every time the chart sharply drops below 25% it has been a buying opportunity. If you don't quite remember what the S&P 500 looks like for the period I have reproduced it below...

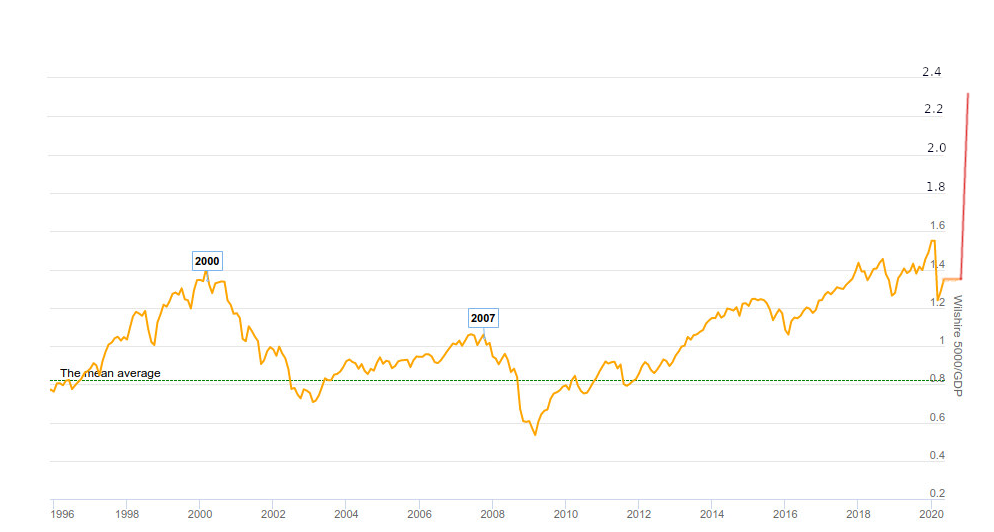
There were plenty of times when the ratio went under 30% between 1988 and 1994, and if you had purchased stock during that period you would have done well. Same thing for 2003 and 2009. In 2015, stocks may have looked overpriced, but the index was at around 2,000 points, and in May 31, 2020, the index is priced at around 3,000 or a 50% gain.
So what does the 8-week moving average of the AAII bullish sentiment index looks like today? Ycharts provides a free 5-year chart updating weekly for use to check.

At the time of the 2016 presidential election, the index was at 25%, a buying opportunity based on this index. But at the time, I was personally really wary of buying US stocks considering the length of the bull market, and other metrics.
What about today? The index stands at 29.50%, so retail investors are fairly bearish although not extremely so. Almost everything else cries "sell!!!", but the AAII sentiment survey tells me to wait a little longer, or strangely enough there should even be a buying opportunity, but I'd like to give it a pass.
Also, remember that's a presidential election year in the US, so politicians in power won't be shy to spend money they don't have, as we've seen in recent months in order to keep the system going, and are greatly helped with the federal reserve with their unlimited buying power. Could they just throw enough money at the system to keep it going for 5 more months until the election? I don't know but would not rule out the possibility.
While AAII sentiment survey looks useful to spot buying opportunity, it does not seem to be a good timing indicator for selling stocks. In 2000, it works, but was completely useless for the 2007 peak, and would have made people sell their stocks later in 2004, and in 2011 with bull markets in their early stages.