Showing posts with label investment ideas. Show all posts

Sunday, May 17, 2020

US Market Cap to GDP Forecast: 230% in Q2 2020

In our April 19 post entitled "All is Well! FAANG Stocks Hit All Times High as the Economy Collapses", we noted incredible disparities between the economy and the market. One of the metrics we used was the US market cap to GDP, aka the Buffet Indicator, which gives a sense of the valuation of the overall stock market (Willshire 5000) against the economy as measured by the GDP.

It was around 130& at the time, a level considered to represent an overvalued stock market, with 80% being fair-valued. As the stock market continued recovering, and the GDP "only" dropped by 4.8% in Q1 2020 for a total of 21.54 trillion dollars annualized, the ratio became slightly worse, and today it is at about 134%.


But once numbers for Q2 2020 come out, there will need to be adjustments. Either the stock market lowers to keep the ratio realistic, or it ignored the news, and the market cap to GDP goes to lalaland at levels never seen before... So what kind of scenario may happen? To find out we'll take the more recent Atlanta Fed GDPNow forecast for Q2 2020.

That would be a 42.8% drop (annualized). So If I understand correctly, we'd take the 21.54 trillion dollars mentioned in the introduction, and deduct 42.8% for it. Total: 12.32 trillion dollars or about the same amount of 2004 GDP.
Now that looks really bad, but it should also be temporary with massive jumps in GDP in Q3 and Q4 2020. If we get back to 18+ trillion dollars that would be a ~50% GDP growth over two quarters. Still significantly lower than previously,  but that should allow some politicians to boast about economic performance...

What would that do to the US market cap to GDP ratio, if stocks were to stay at the current levels? We already have the estimated GDP (12.32 trillion), so we need the Wilshire 5000 market cap that is 28.77 trillion (courtesy of Ycharts).

That a cool ratio of 233% market cap to GDP... Let's represent this on a chart...
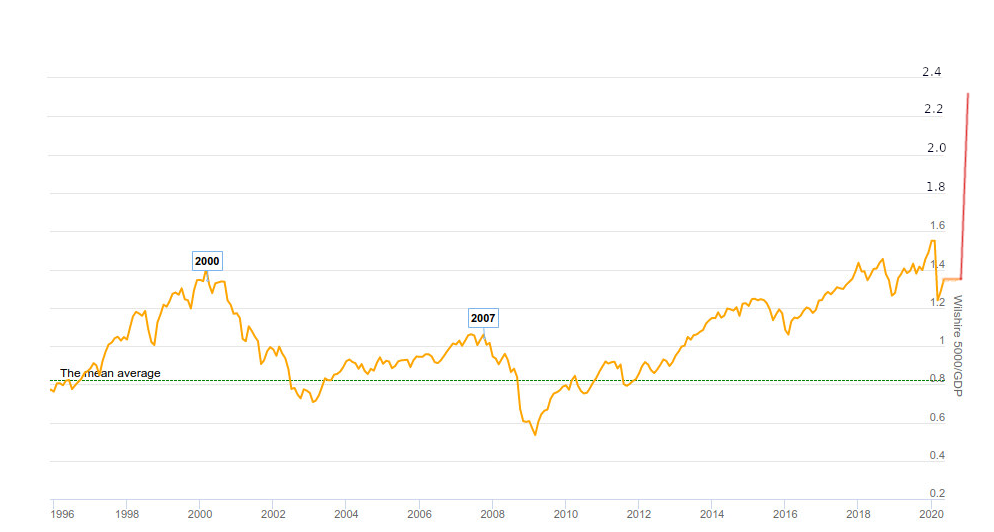

Beautiful! Although it's temporary, as it will come down as GDP eventually increases significantly once economies reopen.

Let's look at scenario two, where stocks magically adjust to the new GDP number. That one may not be quite realistic because markets are supposed to adjust themselves to future outcomes, although the markets have not been very good at it. But anyway, a 134% ratio would mean the Wilshire 5000 would drop from 28.77 trillion to 16.50 trillion, or a 42.6% drop.

Since most people don't follow the Wilshire 500, let's apply the 42.6% drop to the S&P 500 index at 2,863.70 points on May 15. That would make it drop to 1,643 points.

Q2 2020 GDP first official estimate is supposed to be released in July 2020, hence the strange shape of our chart. Note at 134% TCM to GDP, the stock market would be vastly overvalued if we ignore future GDP growth.

But let's take a more realistic scenario that assumes the Federal Reserve does not completely go crazy with the money supply. We would get back to 18 trillion GDP, with a fairly valued stock market (and fairly pessimistic investor sentiment) at 80% of GDP. In this case, the Wilshire 5000 would have a market capitalization of 14.4 trillion dollars. That's even lower than our case above but spread over a longer period of time. Where would be the S&P 500 then, let's say in H1 2021? That's roughly a 50% drop, meaning the S&P 500 would be around 1,430 points, the Dow Jones under 12,000. I think you get the point, no chart needed...

Happy investing, and good luck!

Wednesday, March 7, 2012

Silver and Gold Next Buying Opportunity: $25 and $1500

All markets have started to correct including Gold and Silver. Let's see if we can analyze trends to find entry points for the precious metals. I should note that If you have little exposure, any time is a good time to buy physical Gold and Silver simply to protect yourself against financial apocalypse, even if the possibility is remote. Simply view it as an insurance and one where you are likely to get your premium back !

First, let's have a look at Silver which have been correcting since April 2011 after nearly hitting 50 USD. (Charts: Boursorama.com)

We can clearly see a descending channel since April 2011 and if the trends continue, we should see Silver close to 25 USD where it should be another good time to aggressively add to your positions. Now let's see a longer perspective with a 15-year logarithmic chart.
The long term trend is clearly on the upside and the interesting is that the lower line of the channel is around 25 USD. That means that if you believe in the long term fundamentals of Silver (central banks will have to monetize debt, shortages etc...), you should really be an aggressive buyer below 26 USD.

Now let's have a look at Gold with a chart between October 2010 and March 2012 which shows Gold peaked in September 2011 and have been correcting since. If the trend continue we could reach about 1500 USD.

If we look at the long term chart, here again there is a clear uptrend channel with the lower line just below 1500 USD and it would again be a tremendous buying opportunity like in October 2008 or August 2005.
To conclude based on the trends mentioned above, we could be close to a multi-year buying opportunity for both Gold and Silver. There is no way to tell for sure, but if the chart continues their trend, those opportunities should occur in April or May 2012. There is always the Iran war scenario (where precious metals would just go ballistic), but I very much doubt that Obama would go to war against Iran before the presidential elections in November 2012.

Friday, February 24, 2012

Jeremy Grantham's Quarterly Newsletter February 2012 Summary

Jeremy Grantham, GMO, has just released its Quarterly Newsletter entitled "The Longest Quarterly Letter Ever" a 15 pages report divided into 3 parts in contrast to his previous Letter "The Shortest Quarterly Letter Ever" with 4 pages only.

Part I: Investment Advice from Your Uncle Polonius
In the first part, which he could also have called "the 10 commandments of the individual investor", he gave 10 recommendations:
  1. Believe in history - Be patient and fair for assets to be at or below fair value
  2. Neither a lender nor a borrower be - Avoid leverage because it impacts an investor greatest asset: Patience
  3. Don't put all your treasure in one boat - If you diversify, your portfolio will be much more resilient
  4. Be patient and focus on the long term - Wait until markets are very cheap before making your move. Individual stocks usually recover, and markets always do.
  5. Recognize your advantages over the professional - Again, patience is your asset. Professional cannot wait to career and/or business risk (losing one's job or clients due to short term underperformance). You can afford to wait several years, professionals can't.
  6. Try to contain natural optimism - This is especially true for Australian and US investors that do not like to hear bad news
  7. But on rare occasions, try hard to be brave - You can't take bigger risks than professionals when markets are extremely mispriced even though it may come with pain in the short term.
  8. Resist the crowd: cherish numbers only - If you see your neighbors get rich during a bubble, do not jump on the wagon, follow some simple ratios that can help you estimate the markets over/udner valuation.
  9. In the end, it's quite simple.  Really - Workout simple ratios and follow them. For example, the meaning reversion of profit margins and price earnings ratios. GMO does that for the 7-year market forecast.
  10. This above all: To thine own self be true - Know yourself.  If you are easily influenced by others and cannot resist temptation during a bubble, you should NOT manage your own money.
Part II: Your Grandchildren Have No Value (And Other Deficiencies of Capitalism)

In the second section of the newsletter, Jeremy Grantham talks about the shortcomings of capitalism and how it focuses on short term gains and ignore long term pain. Examples are the current debt and resources depletion. The other problem is that capitalism buys (political) influence as was the case with tobacco companies that also insisted smoking tobacco was harmless, and now with energy companies that try to misinform the public and influence regulations.

The main problem, however, is capitalism inability to process finite resources and maintain rapid economic growth as it is mathematically impossible. Many people would cry foul if you say that a decline in population is necessary so that we can live peacefully. Some scientists also estimated that if Indian and Chinese were to catch the average American lifestyle, we would need 3 planets to live sustainably.

To conclude, he says that capital does thousands things better than other systems, but the 2 or 3 where it fails, could bring it down.

Part III: Investment Observations for the New Year

In the last part of the newsletter, he reflects on the year 2011 where most markets ended basically flat. Most equity markets are currently close to fair value, except the S&P 500 with expected returns of only 1% per year.

Overpricing exists in debt markets however. He sees great opportunities in avoiding duration in fixed income and recommend to underweight the most of the US market as a whole.
  • Inflation Hedges
 Although inflation is not an issue right now, it will certainly rear its ugly head soon enough.He recommends stocks, and especially things in the ground such as oild and copper as well as forestry and farmland. He also thins Gold may be a good hedge
  • Resources
Farmland has gone up a lot recently, especially in the US, and GMO is looking for opportunities in foreign markets.

On the other end, natural gas is dirt cheap and the natural gas to crude oil ratio (BTU equivalent) is now 14% which is the lowest in 15 year. Anybody with a brain should look into investing in natural gas. Unfortunately,  he did not give any specifics.

He also said that Gold producers look cheaper than Gold itself.
  • European Complexity
GMO could not comment on the European issue specifically because they do not consider themselves experts in "sovereign debt-regulation-political-monetary mess". However, one or two other companies  - which have a good track record on those issues - seem to be more worried than the rest of the market.

Finally, he gave GMO recommendations for the year ahead:
  • Heavily underweight U.S equities, but not the high quality quartile, which is almost fair price. Non-quality equities, in contrast, have a negative imputed 7-year return after their handsome rally in the last 3 months through to mid-February.
  • Slightly overweight other global equities, which are almost fair price, down from a little cheap at year end.
  • In total, be about neutral in global equities. Yes, there is more than our normal fair share of potential negatives lurking around, but on our data: a) most of the negatives are reflected in stock prices; and b) all fixed income duration is dangerously overpriced. This last situation is, of course, engineered by the Fed, which hopes to drive us all into taking more risk, notably by buying more equities. I hate to oblige, but at current equity prices it just makes sense to do what they want. As mentioned earlier, equities are also good long-term hedges against inflation.
  • Underweight as much as you dare long-term bonds, especially higher-grade sovereign bonds.
  • In the long term, resources in the ground, forestry, and agricultural land are attractive, but come with the usual caveats of the risk of short-term over pricing, so average in.
You can read the complete newsletter for free on GMO website.