Sunday, December 6, 2020

Fraud alert: Olympus International Limited's Facebook and FireEye (FEYE) scam

Scammers never seem to take a break with the latest fraud going through "financial advisors" claiming to work for a small Hong Kong based company called Olympus International Limited. They are using the same expats database as the Brookfield Investment Funds Plc scam, and call potential investors telling them about inside information about FireEye (FEYE) having signed a large contract from Facebook, yet to be publicly announced, and expect the stock to go up at a minimum of 40% in three months.

Getting a call from an investor survey company

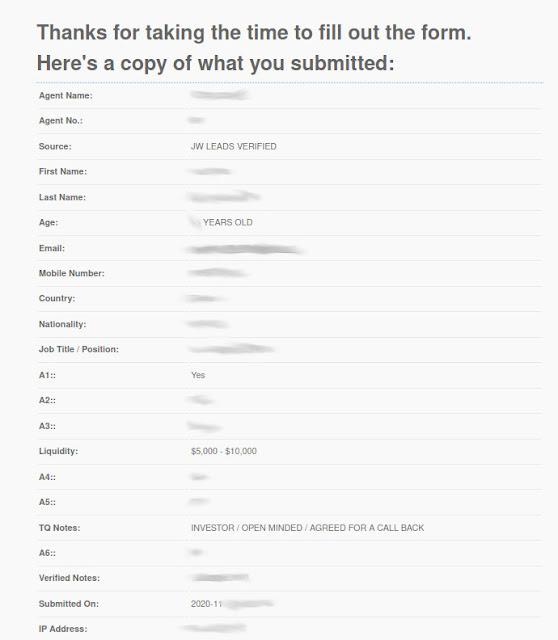
It all start the same way as the Brookfield scam, with a cold call from an investor survey company asking some details about you and your investor profile that takes about 5 minutes. Shortly later you'll received an email summarizing your answers from "clientform@www.dq-datamanager.com".

JW LEADS VERIFIED

They ask about your job, experience in investing, budget to buy stocks, and whether you could be interested in opportunities if they present themselves.

First Olympus International Limited Calls

Then a couple of weeks later, you may received a call from an investment company in this case: Olympus international Limited based in Hong Kong.
 
The financial advisor may speak your native language or English, and they'll offer you short term investment opportunities with close to guaranteed returns. The offer we were made aware for FireEye, listed in the NASDAQ with the sticker FEYE, and claims of inside information about a contract having been signed with Facebook. They claim to be an institutional investment firm, but also work with individual when opportunities arise. They also explain they can purchase the stock as a cheaper price since they buy in large blocks, and ask you to confirm over the phone.

The call we were told about involved Ms. Olivia Martel, Senior Financial Advisor. That's likely a fake name. The website is https://olympusintltd.com/ and telephone: +852 5803 7265. 


Olympus International Limited is real... 


 Hong Kong keeps a company registry so it's easy to check if a company exists.


The company was registered in 2003, so it's been doing business for over 17 years. The company registration number is 0846150 and matches the number used in the emails with seen from the scammers.
 

But cracks can be found pretty quickly...

This almost looks legit, but when we look at the website WHOIS data, it was only created in August 2020, that's a long time for a company to operate without a website. 
 

They optimized their costs too by going with one of the cheapest domain registrar, and the free Let's Encrypt TLS certificate service. But at least everything is under a secure connection contrary to what's we've seen with Brookfield website...

If we look for Olympus International Limited Hong Kong on the web, we can find what types of products they offer: namely ceramic and stainless plates or other kitchen utensils.

 But who am I to judge. Time are tough, and it's possible the company decided to change the direction of the business. But if you're going to offer financial services in Hong Kong you need to register with the Hong Kong Securities and Futures Commission (SFC) which again keeps a database of registered companies.


The only registered company with "Olympus" in the name is "Olympus Partners Asia Limited". But I'm sure Ms. Olivia Martel would not have lie about her status to the face of her client.

No matched record for "Olivia Martel" or even just "<artel"? How is that possible? That's because it's a total scam, and a group of individuals likely using fake names are using the name and CR number of a real, completely unrelated company.

Let's invest in FireEye/Facebook scam!

Most sane people who figured out this was a scam, would just block the number of ignore. So are we still interested? You bet! One Ms. Martel called back, our source said due-diligence was done, and he/she was ready to go ahead with the proposal start with a small $5,000 investment. Once the number of share was agreed upon, price (around $1 cheaper than live quote at the time), and it was explained payment would have to be made through an escrow company and was due within 3 working days. A call from an "SEC compliance officer" called Mr. Michael Winters soon followed double-checking the transaction details and requiring an audio signature by simply saying the full name. 

The purchase was confirmed the following day, and the investor was given a receipt, an account opening form, and a W8 form for US taxes. 


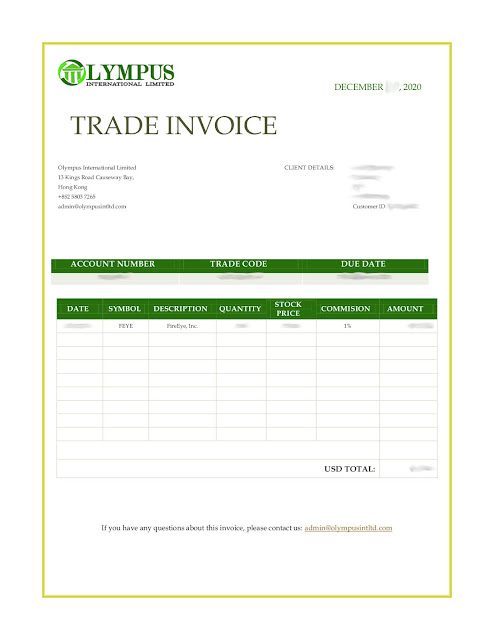
Olympus trade invoice
The procedure is pretty similar to the one used by Brookfield Investment Funds Plc so far, but there's a twist as this time around a proof of address and copy of address is being asked first, before the payment details of the escrow company are provided. That's probably to avoid all those leaks that have happened on this website and others in the past. The escrow company (aka money mule) takes a central part in the scam so they only want to limit the distributions of the information to the minimum. Since our source did not use his/her real name, the use of a fake passport copy and proof of address, and filling a W8 form with falsified information would have been required. We did advise against it.

If you've been scammed, or managed to obtain the money mule information, please let us know in the comments section.

Sunday, August 23, 2020

GMO Forecast July 2020 - Emerging Value is the Only Game in Town

 GMO published their latest 7-year forecast for July 2020, and most asset classes have dismissal expected returns over the next seven years from US large stocks to emerging stocks and large and small international stocks. Let's not even get started with bonds that are just as bad.

While we would consider gold, silver and other so-called real assets to be a potentially good long term investments at this point in time, those are not tracked by GMO, but we've noticed one exception in GMO chart: Emerging value.

9.2% yearly returns over seven would be an excellent investment in those days and age, but as we can see GMO separates emerging and emerging value, so we can't just buy any emerging stocks trackers.

But what's a value stock exactly? Here's Investopedia definition:

A value stock is a security trading at a lower price than what the company’s performance may otherwise indicate. Investors in value stocks attempt to capitalize on inefficiencies in the market, since the price of the underlying equity may not match the company’s performance.

They are often opposed to Growth stocks, often referring to stocks in the Technology and Biotechnology sectors with very high P/E ratios.

 Investopedia main takeaways:

  • Common characteristics of value stocks include high dividend yield, low P/B ratio and/or a low P/E ratio.
  • A value stock typically has a bargain-price as investors see the company as unfavorable in the marketplace.
  • A value stock typically has an equity price lower than stock prices of companies in the same industry.

So value stocks may be dividend stocks with low price-to-book and low price-earning ratio. This includes utilities, banks, consumer staples, and some commodities producers.

So our best bet would be to find value stocks in undervalued emerging markets, which last time we looked included Russia, China, Turkey, Hungary, and South Korea. With Russia, it's easy as most stocks are value stocks, and we could just add a Russia ETF to our portfolio such as MSCI Russia Capped Index (3027.HK) in Hong Kong and VANECK VECTORS/RUSSIA ETF (RSX) in the US.

China is more complex since the stock indexes include highly priced technology company such as Tencent, Allibaba and Baidu. One such option is Value China ETF (3046.HK) whose top holdings include Chinese banks, real-estate companies and insurances.

All companies are listed in the Hong Kong stock market. Alternatively, there's also Value China A-Share ETF (3095 HK) with companies listed in China, and more of a Chinese consumers story with 35% Consumer Goods, 34% Financials.

Note that while Google Finance shows there's no dividend paid out, you'd get ~2% dividend paid out yearly.

I had more of a struggle finding a China value stock in North America, and one of the closest would be Horizons China High Dividend Yield Index ETF (HCN.TO) listed in Canada.

The funds distributed dividends every quarter. The current is 6.77% based on info from Yahoo Finance.

I will not look into Turkey due to geopolitical risks at the moment, nor the smaller Hungary market, and complete this post by checking out South Korea. If you want to invest in South Korea, there's limited choice when it comes to South Korea ETF, and most people will not be able to purchase stocks on the KOSPI exchange.

That means we'd have to accept getting some experience to technology stocks like Samsung Electronics (PE: 17.49, DY: 2.53%), Naver (PE: 64.40, DY: 0.12%),  or  SKHynix (PE:22.3, DY: 1.34%) through South Kora ETF such as iShares MSCI South Korea Index Fund (EWI)


In any case, I'm uncomfortable purchasing stocks in the September-October months due to the high-valuation in the US stock market, and a stock market sell off in the US, may lead to a rise in the US dollars, and a sharp drop in emerging stock markets. If it does happen, it will certainly be an interesting buying opportunity. 

Sunday, July 19, 2020

Long Term Charts - Thai Stock Market (Thai SET) Update - July 2020

It's been a long time since I've not provided an update to long term charts of the Thai stock market. More exactly over 5 years, because to be honest nothing much happened during those years, but we've got a bit more action this year, so it might be a good time to have another look.

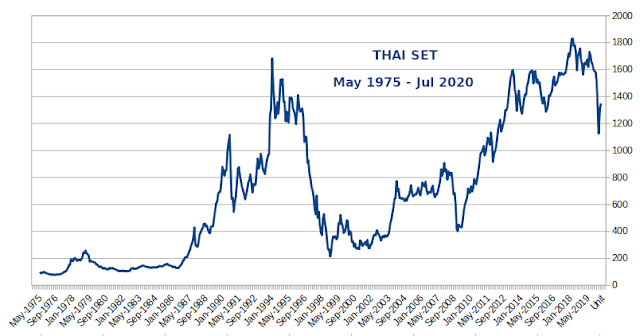
Long Term Chart Thai SET 1976 - 2020

The Thai stock market peaked at around 1,830 in February 2018, and it dropped to under 1,200 in March following the politician answers and lockdowns due to COVID-19. It's back to around 1,350 since them It was a sharp, but let's check more long term charts to find out more about valuations.
Thai SET PER - 1976 - 2020

One metric is the price earning ratio, and never really went under 10 that historically is a buying opportunity. Getting to 5 or under would be a lifetime buying opportunity, but obviously it does not happen often. We should also expect earnings to drop significantly, and I'm not convinced they'll recoever that quickly so the PER should soon go higher, unless the average price of stocks in the Thai SET goes down as well.

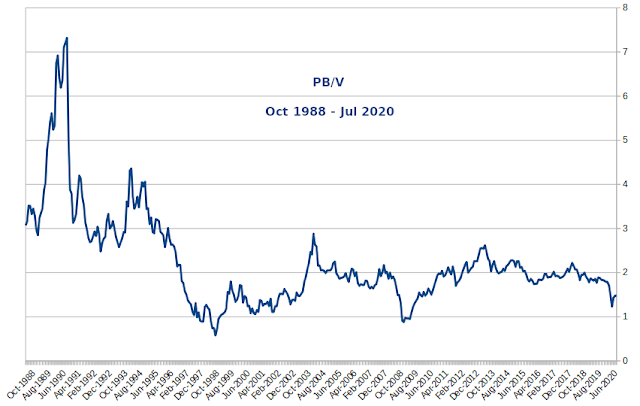
Thai SET Price-to-Book Value - 1988 - 2020

The price to book value ratio is fairly affordable, so that's one metric where the Thai SET looks fair valued or even slightly inexpensive.

Thai SET Dividend Yield - 1988 to 2020

From the chart above, a dividend yield of just under 4% look attractive considering current interest rate on fixed deposits are under 1%. Buying large stocks for dividends might be a good way to be paid to wait with limited downside. That would remain true as long as dividends are not cut, and that's not guaranteed considering the environment we live in.

But no buying on my side for now, so I'll be patient, and since I expect the market to move again this year, I'll likely post an update in December.

Sunday, June 28, 2020

S&P 500 Analysis: Valuation, Sentiment and Technicals - June 2020

It's been a very long time since I have done an S&P 500 analysis with valuation, sentiment and technical indicators taken into account. So let's get an updated picture for June 2020.

S&P 500 Valuation


One way to look at value is to check out the CAPE 10 ratio (Cyclically Adjusted
Price Earnings Ratio over a 10-year period). It now stands at close to 30, and that's before "COVID-19" earnings are released.


That's historically very elevated and similar to the 1929 stock market bubble. Expect the number to shoot with earning announcements if the stock market does not correct first.

Corporate earnings tend to revert to the mean over time.


It's a lagging indicator, as Q2 earnings have not been announced just yet. But the chart shows earnings were way above the historical trend before the crisis. July will be interested as earnings announcement will mean this number possibly goes negative.

AAII Sentiment

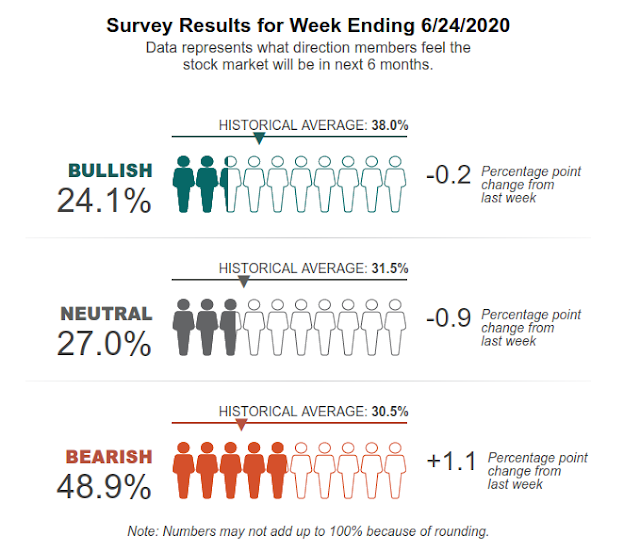
The stock market is all about people's feelings, and AAII members are not buying the rally, as they have still 48.9% bearish.
AAII Sentiment Survey June 2020
We can see the 8-week moving average bullishness chart is still very low.
AAII Sentiment Survey Chart June 2020

The AAII sentiment survey used to be a contrarian indicator, but I'm not sure it's still the case. This would mean stocks have further gains, but in this case I suppose AAII investor believe the market will go down in the next six months, and did not really participate in the rally..

Technical Indicators


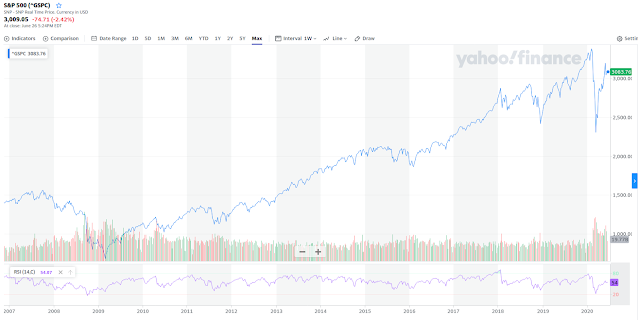
The RSI-14 (14-day relative strength index) can help us find out if a market is oversold or overbought.
RSI-14 S&P 500 June 2020

The RSI-14 is now at 54 or close to neutral. This compares to close to 80 in January/February when markets were clearly overbought in the short term.

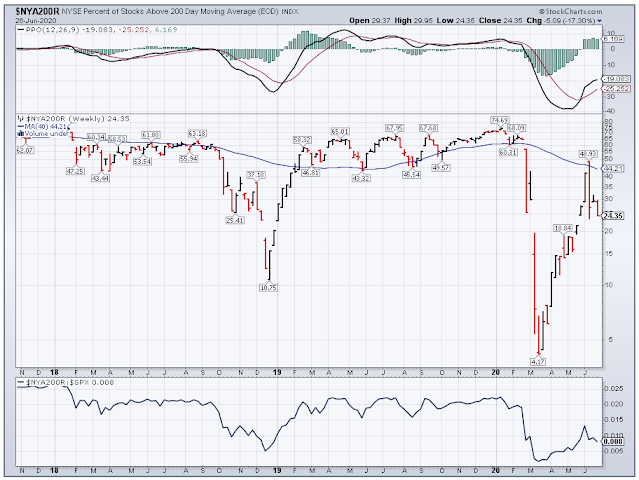
The NYA200R (percentage of stocks over their 200-day moving average) can be used to determine if only a few stocks participated in a rally.

NYA200R  Weekly Chart June 2020


The current chart shows only about 25% of stocks are above their 200-day moving average meaning the elevated S&P 500 stock market level may be due to some  larger capitalization, while smaller stocks are still suffering, or not participating in the rally just as much.

Conclusion

Apart from the US stock market valuation metrics to which we could add the stock market to GDP ratio, we are not really at extremes while looking at sentiment and technical indicators. So I would be very wary of going long, but at the same time the rally may not be over. Another important metrics for investors in 2020 will also be the Federal Reserve assets purchases, but it's pretty hard to forecast what a small group of people will do, especially during a presidential election year.

Saturday, June 27, 2020

The Most Important Chart for Stock Market Investors in 2020

I'm so old I can remember from fundamentals and technical analysis were relevant, but this is 2020, and the most important for stock market investors may well be the chart representing the total assets of the federal reserve.

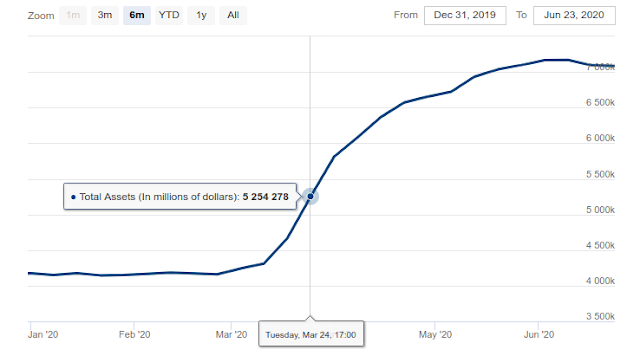
Federal Reserve Assets Chart

Back in September and October 2008, the federal reserve reacted promptly to the bankruptcy of Lehman Brothers, but it was not until March 2009 before the market bottomed out. Since the the balance sheet has gone up with QE 2, QE 3 and operating twist, and it's only when the Federal Reserve Bank started to tamper in 2018 that the stock market become much more volatile, and the FED had to reserve course. The response to COVID-19 sent the assets into the stratosphere, so let's see how it correlates to the S&P 500.

FED reserves 2020

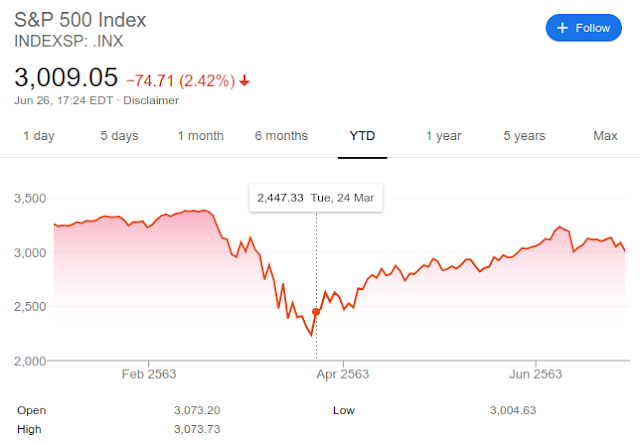
S&P 500 2020 Chart

The FED assets purchase started the week of March 17th, soon after the stock market bottomed out on March 24th, and the S&P 500 went up as long as the FED was purchasing assets. Since then the FED has mostly stopped purchases, and as soon as they started to lower their assets, the S&P 500 followed through.

That means the stock market is highly correlated to the FED's actions, and the rally we've seen since March 23rd may be entirely due to the FED. We should then closely follow the actions of the FED and other central banks for the future direction of the stock market. However, if they overdo it, there may eventually be a currency crisis of some sort. We live in interesting times.


Sunday, June 21, 2020

Scammer Alert: Wells Capital Fund LLC

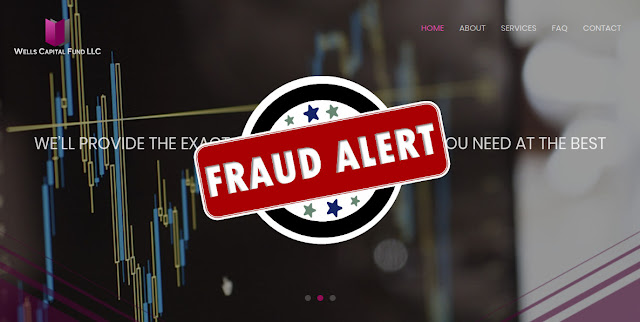
Here's another money mule related to Brookfield Investment Funds Plc company that scams people investing in non-existent shares such as pre-IPOs or "reverse liquidations": Wells Capital Fund LLC.

Wells Capital Fund


Here are the bank details of the company:

Account Name: WELLS CAPITAL FUND LLC
Account Address:
2375 East Camelback Rd.
Suite 600 Phoenix,
AZ 85016
USA
Account Number: 15266430
Bank Name: GREAT WESTERN BANK
Bank Address:
1721 N Arizona Ave.
Suite 1 Chandler,
AZ 85225
USA
Swift Code: GTWBUS44XXX

The website for the company is wellscf dot net with claims of being in business for many years:
For over 20 years Wells Capital Fund LLC has been securing transactions and providing a protected payment process to allow our clients to work more efficiently and secure.
But as usual for this type of company, the website was just registered recently, namely in November 2019.

They can't operate the company for too long, as one year is about the time it will take before it's closed and the scammers move on to another company.

If you have been victim of the fraud make sure to fill a police report against the company in the jurisdiction where the scam occurred. Note they usually only work with expats to make tracking phone calls that much more difficult and costly for the victim and law enforcement.


Sunday, June 14, 2020

Investing using GMO 7-Year Market Forecast

You should always check multiple indicators before investing in a particular asset class or country, and one of those I like to follow is Jeremy Grantham's GMO 7-Year market forecast based on "return-to-the-mean" valuations.

The latest was published on April 30, 2020.

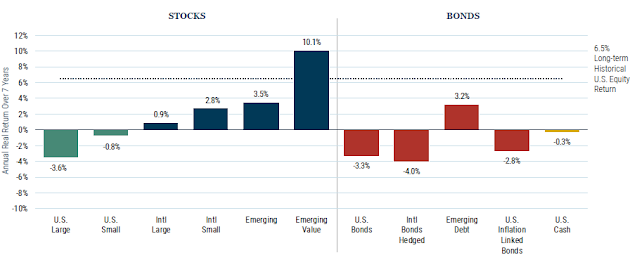
GMO 7-year Forecast April 2020


That means large U.S caps should return a real negative 3.6% per year over the next seven years with 2.2% US annual inflation. Or around negative 1.4% per year once inflation is taking into account, while emerging stocks should return 3.5% per year plus inflation (no assumption for non-US asset classes).

So how well does not indicator actually work? It's clear it's not an exact timing tool, as it will likely be incorrect during a bull market, and become right once a bear market occurs. But let's check about past 7-year forecasts, namely:

  1. GMO 7-year forecast Q1 2011 with a -2.8% annual return forecast for small U.S caps.

  2. GMO 7-Year Asset Class Forecasts - October 2012 with a -0.3% annual return forecast for large U.S. caps.

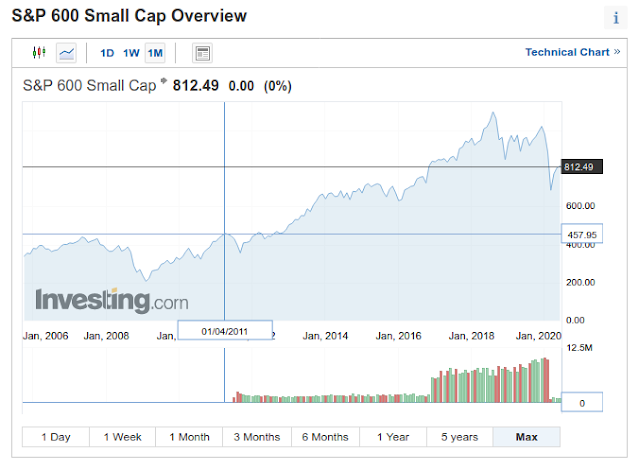
I'm not sure which indices GMO is using exactly, but I'll go with the S&P SmallCap 600 Index (S&P 600) and Dow Jones Industrial Average (DJI) respectively.
S&P 600
Source: Investing.com

The S&P 600 was at 457.95 points on April 1, 2011. With a -2.8% real annual return, plus 2.2% inflation, the S&P 600 should have been at 439 points on April 1, 2018 with a return to the mean. But the actual level of the S&P 600 was about 947 points.It still did not happen two years later, but maybe latter the year, or next, as the US market is very much overvalued.

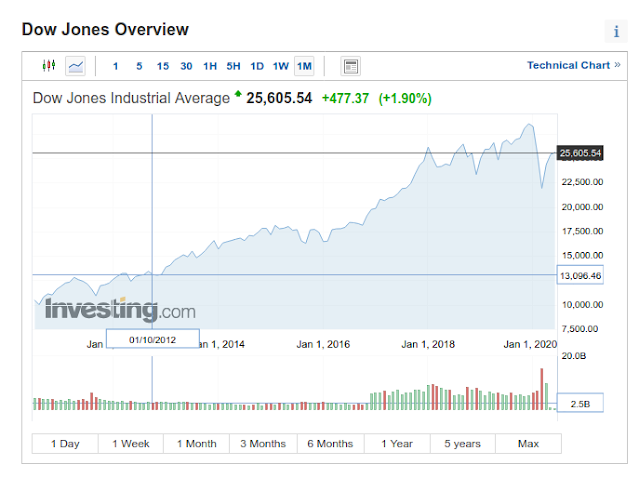
Let's switch to the Dow Jones now for October 1, 2012 and October 1, 2019.
Dow Jones 2012-2019

The Dow Jones was at 13,096 points on the October 1, 2012. A -0.3% real annual return with 2.2% inflation would mean the index should have been at
14,960 points on October 1, 2019 assuming a return to the mean. Actual Dow Jones level on October 1, 2019: 25,605 points. It did not work too well either for large caps, but I believe that's yet another indicator that US stocks are vastly overvalued. How long the craziness will last is for anyone to guess.


Sunday, May 31, 2020

The Case for Stocks Going Higher - Retail Investors are Still Bearish

As we covered previously, there are plenty of metrics screaming the US stock market is in lalaland as one of the most overvalued markets (even before COVID-19), a complete disconnect between the economy and the stock market with the Wilshire 5000 to GDP ratio - aka Buffet Indicator - expected to reach around 230% by the end of July with the first Q2 GDP numbers.

When we asked whether the stock market rally was over on May 3rd, we noted the 1929 stock market rally took several months and our 1929 Redux simulation would take to it to May/June. We also pointed out one metric suggested it may have more legs: the AAII sentiment survey, or the bullishness/bearishness of the retail investor. We did not look into it too much at the time, so let's do that today by first looking at a 1998 to 2015 chart of the AAII bullishness 8-week moving average data courtesy of investing.com.


We can see every time the chart sharply drops below 25% it has been a buying opportunity. If you don't quite remember what the S&P 500 looks like for the period I have reproduced it below...
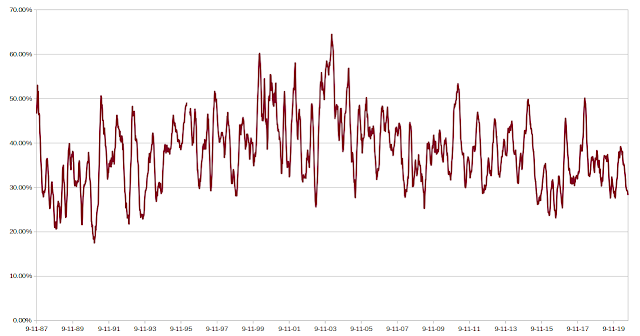
There were plenty of times when the ratio went under 30% between 1988 and 1994, and if you had purchased stock during that period you would have done well. Same thing for 2003 and 2009. In 2015, stocks may have looked overpriced, but the index was at around 2,000 points, and in May 31, 2020, the index is priced at around 3,000 or a 50% gain.

So what does the 8-week moving average of the AAII bullish sentiment index looks like today? Ycharts provides a free 5-year chart updating weekly for use to check.


At the time of the 2016 presidential election, the index was at 25%, a buying opportunity based on this index. But at the time, I was personally really wary of buying US stocks considering the length of the bull market, and other metrics.

What about today? The index stands at 29.50%, so retail investors are fairly bearish although not extremely so. Almost everything else cries "sell!!!", but the AAII sentiment survey tells me to wait a little longer, or strangely enough there should even be a buying opportunity, but I'd like to give it a pass.

Also, remember that's a presidential election year in the US, so politicians in power won't be shy to spend money they don't have, as we've seen in recent months in order to keep the system going, and are greatly helped with the federal reserve with their unlimited buying power.  Could they just throw enough money at the system to keep it going for 5 more months until the election? I don't know but would not rule out the possibility.

While AAII sentiment survey looks useful to spot buying opportunity, it does not seem to be a good timing indicator for selling stocks. In 2000, it works, but was completely useless for the 2007 peak, and would have made people sell their stocks later in 2004, and in 2011 with bull markets in their early stages.


Sunday, May 24, 2020

People behind Brookfield Investment Funds Plc and Kaloca Inc Investment Fraud

We first wrote about Brookfield Investment Funds Plc when covering AirBnB and Virgin Hyperloop One Pre-IPO scams. This is a non-existent company that claims to be based in Ireland and the United Kingdom and receive payments through "money mules" that are recently incorporated financial companies such as Singapore based Vipco Holding Pte and WELLINGTON YORK PARTNERS PTE. LTD.,  John Jennings law office in Germany, or Kaloca Inc in the US.

Somehow, the scammers are still free to operate but at least the Financial Conduct Authority in the UK and Ireland has finally written warnings about Brookfield Investment Funds Plc "clone firm" that mislead investors by claiming to be an already authorized firm.

Derek Nguyen - Kaloca Inc. CEO
But we have now received more information from a victim of Brookfield Investment Funds Plc scam, who paid to Kaloca Inc., and hired a private detective to look into the matter.

Amazingly Kaloca Inc. company has been registered by a recidivist, Mr. Derek Nguyen, who previously another scam company under the name Kaloca Holdings Inc. He is now CEO at Kaloca Inc, and both companies point to the same, non-loading website kaloca dot com.

Based on investigative work, Brookfield scammers are mostly working out of Northern Virginia with Carl Bryce likely being a scammer on the West Coast, and others are using fake names. Gregory Ellis, who is allegedly working with them, had been arrested in Thailand in 2013, then jailed by the DOJ, but was eventually released from prison and went back to his old trade.

While the walls are closing in on the scammers, various authorities are involved, victims are often taken in a circular loop, where each agency point to the other one to solve the issue. We'll keep you posted if more information comes out. Feel free to contact us if you are a victim, as if more people come together there's a better change to recover the funds.

Sunday, May 17, 2020

US Market Cap to GDP Forecast: 230% in Q2 2020

In our April 19 post entitled "All is Well! FAANG Stocks Hit All Times High as the Economy Collapses", we noted incredible disparities between the economy and the market. One of the metrics we used was the US market cap to GDP, aka the Buffet Indicator, which gives a sense of the valuation of the overall stock market (Willshire 5000) against the economy as measured by the GDP.

It was around 130& at the time, a level considered to represent an overvalued stock market, with 80% being fair-valued. As the stock market continued recovering, and the GDP "only" dropped by 4.8% in Q1 2020 for a total of 21.54 trillion dollars annualized, the ratio became slightly worse, and today it is at about 134%.


But once numbers for Q2 2020 come out, there will need to be adjustments. Either the stock market lowers to keep the ratio realistic, or it ignored the news, and the market cap to GDP goes to lalaland at levels never seen before... So what kind of scenario may happen? To find out we'll take the more recent Atlanta Fed GDPNow forecast for Q2 2020.

That would be a 42.8% drop (annualized). So If I understand correctly, we'd take the 21.54 trillion dollars mentioned in the introduction, and deduct 42.8% for it. Total: 12.32 trillion dollars or about the same amount of 2004 GDP.
Now that looks really bad, but it should also be temporary with massive jumps in GDP in Q3 and Q4 2020. If we get back to 18+ trillion dollars that would be a ~50% GDP growth over two quarters. Still significantly lower than previously,  but that should allow some politicians to boast about economic performance...

What would that do to the US market cap to GDP ratio, if stocks were to stay at the current levels? We already have the estimated GDP (12.32 trillion), so we need the Wilshire 5000 market cap that is 28.77 trillion (courtesy of Ycharts).

That a cool ratio of 233% market cap to GDP... Let's represent this on a chart...


Beautiful! Although it's temporary, as it will come down as GDP eventually increases significantly once economies reopen.

Let's look at scenario two, where stocks magically adjust to the new GDP number. That one may not be quite realistic because markets are supposed to adjust themselves to future outcomes, although the markets have not been very good at it. But anyway, a 134% ratio would mean the Wilshire 5000 would drop from 28.77 trillion to 16.50 trillion, or a 42.6% drop.

Since most people don't follow the Wilshire 500, let's apply the 42.6% drop to the S&P 500 index at 2,863.70 points on May 15. That would make it drop to 1,643 points.

Q2 2020 GDP first official estimate is supposed to be released in July 2020, hence the strange shape of our chart. Note at 134% TCM to GDP, the stock market would be vastly overvalued if we ignore future GDP growth.

But let's take a more realistic scenario that assumes the Federal Reserve does not completely go crazy with the money supply. We would get back to 18 trillion GDP, with a fairly valued stock market (and fairly pessimistic investor sentiment) at 80% of GDP. In this case, the Wilshire 5000 would have a market capitalization of 14.4 trillion dollars. That's even lower than our case above but spread over a longer period of time. Where would be the S&P 500 then, let's say in H1 2021? That's roughly a 50% drop, meaning the S&P 500 would be around 1,430 points, the Dow Jones under 12,000. I think you get the point, no chart needed...

Happy investing, and good luck!

Sunday, May 3, 2020

May 2020 - Is the Bear Market Rally Over?

When we discussed whether 2020 might be the Great Depression of 1929 All Over Again on March 22, 2020, we applied the monthly Dow Jones chart variations of 1929 to the chart 2020 and noticed there may be a rebound soon.
2020 Redux of 1929 Dow Jones chart

and the market indeed started to rally almost immediately, then we thought we might get back to around 23,000 points by May/June, and plateau there for a while...

We've gone beyond that level to almost 25,000 now as shown by the 3-month daily until May 1st. So it might be a good time checking out technicals again, as we all know fundamentals look horrible.


The red line above corresponds to the 61.8% Fibonacci retracement, a bearish technical indicator that could indicate the bear market rally may be over, and we may at least re-test the low.


If we look at the 14-day relative strength index (RSI-14), we can see a top at 59.76 on April 29, not quite oversold just yet, but close to the level we were on February 18, 2020 top (RSI-14 = ~65).


Individual investors are not overly bullish and stay bearing on aggregate with a -13.43% bull-bear spread, which means this rally may last a bit longer.


In "normal times", I'd have no problem shorting this market, but with Central bank involvement we simply don't know where's it's going. The BOJ (Bank of Japan) has been printing money for years, and it has not helped their market a bit, but if we turn our eyes on Venezuela, and the Caracas market, money printing does work... when it comes to boosting the stock market.

That's over ten times return on investment over one year, and 210.94% since the beginning of 2020 in local currency... But the Venezuelan BolĂ­var crashed compared to the US Dollar, and the country is suffering from hyperinflation, something that's highly unlikely in developed economies in the short term, but not completely impossible over the long term depending on central banks actions.

We still favor "sell in May and go away" for the S&P 500, Dow Jones, and most markets around the world.


Sunday, April 19, 2020

All is Well! FAANG Stocks Hit All Times High as the Economy Collapses

The economy is in shamble with predictions of 20%+ drop in Q2 GDP and so far 22 million people filing for unemployment in the US in the last four weeks, but the market acts as if nothing happened with the NASDAQ positive for the year.
A lot of it as to do with the various government stimulus, FED balance sheet going through the roof, as well as more demand from companies providing services for the many "work from home" (WFH) workers due to lockdowns.

But if we look into the details it's not that pretty, as FAANG stocks are responsible for most of the rise. In other words, it's not a broad market rally, and many NASDAQ stocks are still way down.

From a historical perspective, most bear markets will have a bear market rally, as shown from the S&P 500 chart below between 1998 and 2020. Source: NorthmanTrader.


You could always say "but Dark Horse, 2020 won't be like the great depression, and instead, it's just like 1987, we had the "best economy ever" and it's all up from here after everybody goes back to work + FED put!". To that argument, I'd answer the market was not overextended in 1987 as shown by the market cap to GDP ratio aka "buffer indicator".
Before the crash in 1987, the market cap to GDP was just 64%, and now it's around 130% before dismissal GDP numbers are announced meaning it should be above the previous record soon.

I'm a big believer in mean reversion of things like market cap to GDP and PER ratio / CAPE ratio. We previously wrote how many markets were overvalued including the US markets, and GMO just released their quarterly update with their expectations of yearly returns for various markets over a 7-year period.

That means large US stocks may lose around 1.5% a year over the next seven years, not a nice proposition especially when considering those numbers were after the correction in March 2020. Also note bonds don't look to be a good place to hide either, but emerging value stocks have some good prospects, and we previously mentioned that Chinese commodity producers may be a place to look for investment opportunities.

I'd still stay very prudent here as there are many risks around. We are quite surprised people expect a vaccine by 12 to 18 months, as we would like to remind our readers that some virus-induced diseases don't have a vaccine, think AIDS or dengue fever. The latter is even scarier because you don't develop immunity, and instead, the risk of death is greater the second time, and even more the third time. There have been reports that released COVID-19 patients have contracted the disease again, so herd immunity is not even a given, but so far there's no indication that the second infection is nastier like for dengue fever.

Stay safe! We live in scary times for our health, finances, and freedom from governments.