Sunday, June 28, 2020

S&P 500 Analysis: Valuation, Sentiment and Technicals - June 2020

It's been a very long time since I have done an S&P 500 analysis with valuation, sentiment and technical indicators taken into account. So let's get an updated picture for June 2020.

S&P 500 Valuation


One way to look at value is to check out the CAPE 10 ratio (Cyclically Adjusted
Price Earnings Ratio over a 10-year period). It now stands at close to 30, and that's before "COVID-19" earnings are released.


That's historically very elevated and similar to the 1929 stock market bubble. Expect the number to shoot with earning announcements if the stock market does not correct first.

Corporate earnings tend to revert to the mean over time.


It's a lagging indicator, as Q2 earnings have not been announced just yet. But the chart shows earnings were way above the historical trend before the crisis. July will be interested as earnings announcement will mean this number possibly goes negative.

AAII Sentiment

The stock market is all about people's feelings, and AAII members are not buying the rally, as they have still 48.9% bearish.
AAII Sentiment Survey June 2020
We can see the 8-week moving average bullishness chart is still very low.
AAII Sentiment Survey Chart June 2020

The AAII sentiment survey used to be a contrarian indicator, but I'm not sure it's still the case. This would mean stocks have further gains, but in this case I suppose AAII investor believe the market will go down in the next six months, and did not really participate in the rally..

Technical Indicators


The RSI-14 (14-day relative strength index) can help us find out if a market is oversold or overbought.
RSI-14 S&P 500 June 2020

The RSI-14 is now at 54 or close to neutral. This compares to close to 80 in January/February when markets were clearly overbought in the short term.

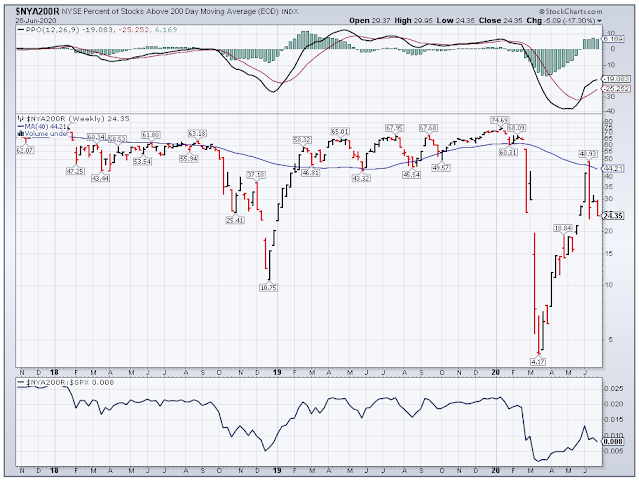
The NYA200R (percentage of stocks over their 200-day moving average) can be used to determine if only a few stocks participated in a rally.

NYA200R  Weekly Chart June 2020


The current chart shows only about 25% of stocks are above their 200-day moving average meaning the elevated S&P 500 stock market level may be due to some  larger capitalization, while smaller stocks are still suffering, or not participating in the rally just as much.

Conclusion

Apart from the US stock market valuation metrics to which we could add the stock market to GDP ratio, we are not really at extremes while looking at sentiment and technical indicators. So I would be very wary of going long, but at the same time the rally may not be over. Another important metrics for investors in 2020 will also be the Federal Reserve assets purchases, but it's pretty hard to forecast what a small group of people will do, especially during a presidential election year.

Saturday, June 27, 2020

The Most Important Chart for Stock Market Investors in 2020

I'm so old I can remember from fundamentals and technical analysis were relevant, but this is 2020, and the most important for stock market investors may well be the chart representing the total assets of the federal reserve.

Federal Reserve Assets Chart

Back in September and October 2008, the federal reserve reacted promptly to the bankruptcy of Lehman Brothers, but it was not until March 2009 before the market bottomed out. Since the the balance sheet has gone up with QE 2, QE 3 and operating twist, and it's only when the Federal Reserve Bank started to tamper in 2018 that the stock market become much more volatile, and the FED had to reserve course. The response to COVID-19 sent the assets into the stratosphere, so let's see how it correlates to the S&P 500.

FED reserves 2020

S&P 500 2020 Chart

The FED assets purchase started the week of March 17th, soon after the stock market bottomed out on March 24th, and the S&P 500 went up as long as the FED was purchasing assets. Since then the FED has mostly stopped purchases, and as soon as they started to lower their assets, the S&P 500 followed through.

That means the stock market is highly correlated to the FED's actions, and the rally we've seen since March 23rd may be entirely due to the FED. We should then closely follow the actions of the FED and other central banks for the future direction of the stock market. However, if they overdo it, there may eventually be a currency crisis of some sort. We live in interesting times.


Sunday, June 21, 2020

Scammer Alert: Wells Capital Fund LLC

Here's another money mule related to Brookfield Investment Funds Plc company that scams people investing in non-existent shares such as pre-IPOs or "reverse liquidations": Wells Capital Fund LLC.

Wells Capital Fund


Here are the bank details of the company:

Account Name: WELLS CAPITAL FUND LLC
Account Address:
2375 East Camelback Rd.
Suite 600 Phoenix,
AZ 85016
USA
Account Number: 15266430
Bank Name: GREAT WESTERN BANK
Bank Address:
1721 N Arizona Ave.
Suite 1 Chandler,
AZ 85225
USA
Swift Code: GTWBUS44XXX

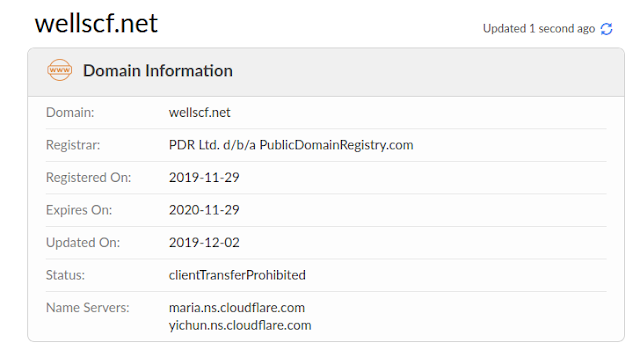
The website for the company is wellscf dot net with claims of being in business for many years:
For over 20 years Wells Capital Fund LLC has been securing transactions and providing a protected payment process to allow our clients to work more efficiently and secure.
But as usual for this type of company, the website was just registered recently, namely in November 2019.

They can't operate the company for too long, as one year is about the time it will take before it's closed and the scammers move on to another company.

If you have been victim of the fraud make sure to fill a police report against the company in the jurisdiction where the scam occurred. Note they usually only work with expats to make tracking phone calls that much more difficult and costly for the victim and law enforcement.


Sunday, June 14, 2020

Investing using GMO 7-Year Market Forecast

You should always check multiple indicators before investing in a particular asset class or country, and one of those I like to follow is Jeremy Grantham's GMO 7-Year market forecast based on "return-to-the-mean" valuations.

The latest was published on April 30, 2020.

GMO 7-year Forecast April 2020


That means large U.S caps should return a real negative 3.6% per year over the next seven years with 2.2% US annual inflation. Or around negative 1.4% per year once inflation is taking into account, while emerging stocks should return 3.5% per year plus inflation (no assumption for non-US asset classes).

So how well does not indicator actually work? It's clear it's not an exact timing tool, as it will likely be incorrect during a bull market, and become right once a bear market occurs. But let's check about past 7-year forecasts, namely:

  1. GMO 7-year forecast Q1 2011 with a -2.8% annual return forecast for small U.S caps.

  2. GMO 7-Year Asset Class Forecasts - October 2012 with a -0.3% annual return forecast for large U.S. caps.

I'm not sure which indices GMO is using exactly, but I'll go with the S&P SmallCap 600 Index (S&P 600) and Dow Jones Industrial Average (DJI) respectively.
S&P 600
Source: Investing.com

The S&P 600 was at 457.95 points on April 1, 2011. With a -2.8% real annual return, plus 2.2% inflation, the S&P 600 should have been at 439 points on April 1, 2018 with a return to the mean. But the actual level of the S&P 600 was about 947 points.It still did not happen two years later, but maybe latter the year, or next, as the US market is very much overvalued.

Let's switch to the Dow Jones now for October 1, 2012 and October 1, 2019.
Dow Jones 2012-2019

The Dow Jones was at 13,096 points on the October 1, 2012. A -0.3% real annual return with 2.2% inflation would mean the index should have been at
14,960 points on October 1, 2019 assuming a return to the mean. Actual Dow Jones level on October 1, 2019: 25,605 points. It did not work too well either for large caps, but I believe that's yet another indicator that US stocks are vastly overvalued. How long the craziness will last is for anyone to guess.