Showing posts with label usa. Show all posts

Saturday, August 13, 2022

Money mules in 2022 - DTCC Inc and Xinjiwang Limited

We've been reporting on the Brookfield investment scam for a couple of years, and while the "company" website has now been taken taken down, the scammer are still on the loose, and now requesting further wire transfer from victims under the
Dunne and Walsh in Ireland or the Washington Fiduciary Trust Services in the US.

Those are obviously only fake companies and organizations, but they are trying to scam people through real accounts, the so-called money mules, in Hong Kong and the US.

The first company is Xinjiwang Limited registered in Hong Kong at the address:

23-38 Kwai Cheong Road,
New Territories,
Hong Kong

and using HSBC bank account number: 454385733838.

The second company is DTCC Inc registered in the US at the address:

570, Washington Blvd, Jersey City, NJ 07310

and using Bank of America account number 325128858097

This will hopefully help a few people. Stay safe are financial scammers are as active as ever.


Sunday, June 21, 2020

Scammer Alert: Wells Capital Fund LLC

Here's another money mule related to Brookfield Investment Funds Plc company that scams people investing in non-existent shares such as pre-IPOs or "reverse liquidations": Wells Capital Fund LLC.

Wells Capital Fund


Here are the bank details of the company:

Account Name: WELLS CAPITAL FUND LLC
Account Address:
2375 East Camelback Rd.
Suite 600 Phoenix,
AZ 85016
USA
Account Number: 15266430
Bank Name: GREAT WESTERN BANK
Bank Address:
1721 N Arizona Ave.
Suite 1 Chandler,
AZ 85225
USA
Swift Code: GTWBUS44XXX

The website for the company is wellscf dot net with claims of being in business for many years:
For over 20 years Wells Capital Fund LLC has been securing transactions and providing a protected payment process to allow our clients to work more efficiently and secure.
But as usual for this type of company, the website was just registered recently, namely in November 2019.

They can't operate the company for too long, as one year is about the time it will take before it's closed and the scammers move on to another company.

If you have been victim of the fraud make sure to fill a police report against the company in the jurisdiction where the scam occurred. Note they usually only work with expats to make tracking phone calls that much more difficult and costly for the victim and law enforcement.


Sunday, June 14, 2020

Investing using GMO 7-Year Market Forecast

You should always check multiple indicators before investing in a particular asset class or country, and one of those I like to follow is Jeremy Grantham's GMO 7-Year market forecast based on "return-to-the-mean" valuations.

The latest was published on April 30, 2020.

GMO 7-year Forecast April 2020


That means large U.S caps should return a real negative 3.6% per year over the next seven years with 2.2% US annual inflation. Or around negative 1.4% per year once inflation is taking into account, while emerging stocks should return 3.5% per year plus inflation (no assumption for non-US asset classes).

So how well does not indicator actually work? It's clear it's not an exact timing tool, as it will likely be incorrect during a bull market, and become right once a bear market occurs. But let's check about past 7-year forecasts, namely:

  1. GMO 7-year forecast Q1 2011 with a -2.8% annual return forecast for small U.S caps.

  2. GMO 7-Year Asset Class Forecasts - October 2012 with a -0.3% annual return forecast for large U.S. caps.

I'm not sure which indices GMO is using exactly, but I'll go with the S&P SmallCap 600 Index (S&P 600) and Dow Jones Industrial Average (DJI) respectively.
S&P 600
Source: Investing.com

The S&P 600 was at 457.95 points on April 1, 2011. With a -2.8% real annual return, plus 2.2% inflation, the S&P 600 should have been at 439 points on April 1, 2018 with a return to the mean. But the actual level of the S&P 600 was about 947 points.It still did not happen two years later, but maybe latter the year, or next, as the US market is very much overvalued.

Let's switch to the Dow Jones now for October 1, 2012 and October 1, 2019.
Dow Jones 2012-2019

The Dow Jones was at 13,096 points on the October 1, 2012. A -0.3% real annual return with 2.2% inflation would mean the index should have been at
14,960 points on October 1, 2019 assuming a return to the mean. Actual Dow Jones level on October 1, 2019: 25,605 points. It did not work too well either for large caps, but I believe that's yet another indicator that US stocks are vastly overvalued. How long the craziness will last is for anyone to guess.


Sunday, April 19, 2020

All is Well! FAANG Stocks Hit All Times High as the Economy Collapses

The economy is in shamble with predictions of 20%+ drop in Q2 GDP and so far 22 million people filing for unemployment in the US in the last four weeks, but the market acts as if nothing happened with the NASDAQ positive for the year.
A lot of it as to do with the various government stimulus, FED balance sheet going through the roof, as well as more demand from companies providing services for the many "work from home" (WFH) workers due to lockdowns.

But if we look into the details it's not that pretty, as FAANG stocks are responsible for most of the rise. In other words, it's not a broad market rally, and many NASDAQ stocks are still way down.

From a historical perspective, most bear markets will have a bear market rally, as shown from the S&P 500 chart below between 1998 and 2020. Source: NorthmanTrader.


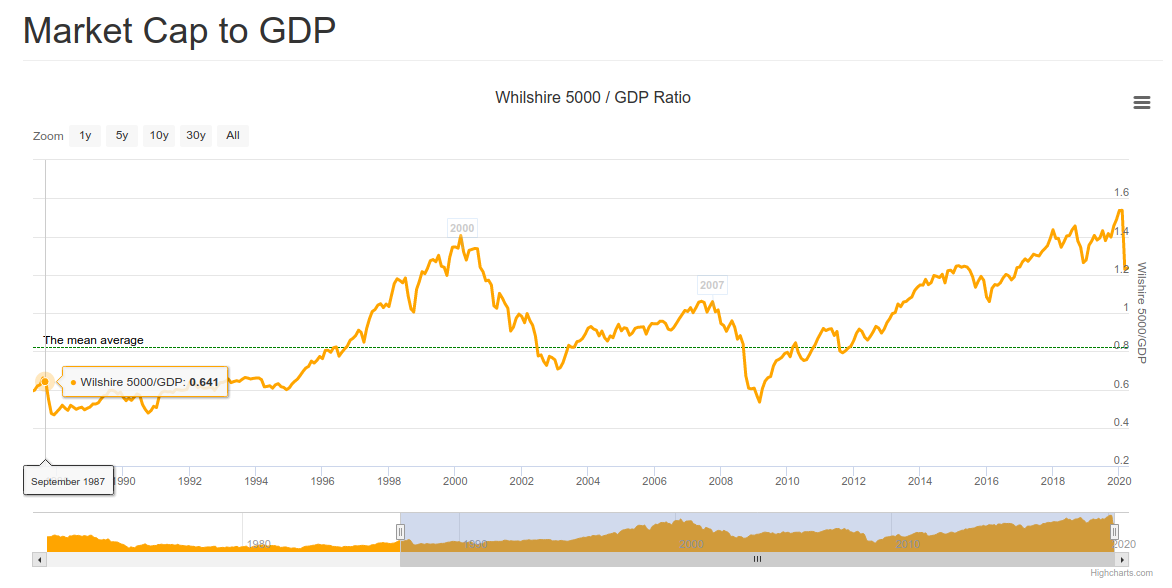
You could always say "but Dark Horse, 2020 won't be like the great depression, and instead, it's just like 1987, we had the "best economy ever" and it's all up from here after everybody goes back to work + FED put!". To that argument, I'd answer the market was not overextended in 1987 as shown by the market cap to GDP ratio aka "buffer indicator".
Before the crash in 1987, the market cap to GDP was just 64%, and now it's around 130% before dismissal GDP numbers are announced meaning it should be above the previous record soon.

I'm a big believer in mean reversion of things like market cap to GDP and PER ratio / CAPE ratio. We previously wrote how many markets were overvalued including the US markets, and GMO just released their quarterly update with their expectations of yearly returns for various markets over a 7-year period.

That means large US stocks may lose around 1.5% a year over the next seven years, not a nice proposition especially when considering those numbers were after the correction in March 2020. Also note bonds don't look to be a good place to hide either, but emerging value stocks have some good prospects, and we previously mentioned that Chinese commodity producers may be a place to look for investment opportunities.

I'd still stay very prudent here as there are many risks around. We are quite surprised people expect a vaccine by 12 to 18 months, as we would like to remind our readers that some virus-induced diseases don't have a vaccine, think AIDS or dengue fever. The latter is even scarier because you don't develop immunity, and instead, the risk of death is greater the second time, and even more the third time. There have been reports that released COVID-19 patients have contracted the disease again, so herd immunity is not even a given, but so far there's no indication that the second infection is nastier like for dengue fever.

Stay safe! We live in scary times for our health, finances, and freedom from governments.

Sunday, March 29, 2020

How Long Will the COVID-19 Response Impact the Economy?

COVID-19 pandemic and its public policy response have caused a massive drop in economic activity. It's a given that Q1 and Q2 GDP numbers will be negative worldwide, but what can we expect going forward?

One way to look a the future is to check how China is doing to far since they were the first impacted and based on data coming from the government managed to contain SARS-CoV-2 virus by the end of February 2020.

COVID-19 Cases in China
This was achieved thanks to draconian lockdown measures, including locking persons suspected to be infected into their home. Shanghai stock market did drop by around 10 percent during Chinese New Year but quickly recovered, until it become clear COVID-19 would have a serious impact all around the world.

The PMI dropped sharply in February to 35.70 points, but we still have to wait longer to know the extent of the rebound in March and April.


Many businesses have re-opened, and while Hubei province has recently re-opened its borders (March 28), neighboring provinces are still wary of letting people travel. We also have contact in China, that non-essential business (e.g. entertainment) will not re-open until the end of April, and that's in Liaoning far from the epicenter in Wuhan. So in China, it's quite possible the local economy returns to normal in May. It would have been 4 full months since the beginning of the spread of the disease. However, China's GDP will certainly be impacted by the drop of activity in the rest of the world that is around 1.5 months behind in terms of cases.

My best-case scenario where the virus is contained around the world as fast as it was in China is that activity returns to "normal", yet somewhat lower levels, in July 2020. That would mean a sharply higher quarter-on-quarter Q3 GDP (worldwide), but still fairly lower year-on-year.

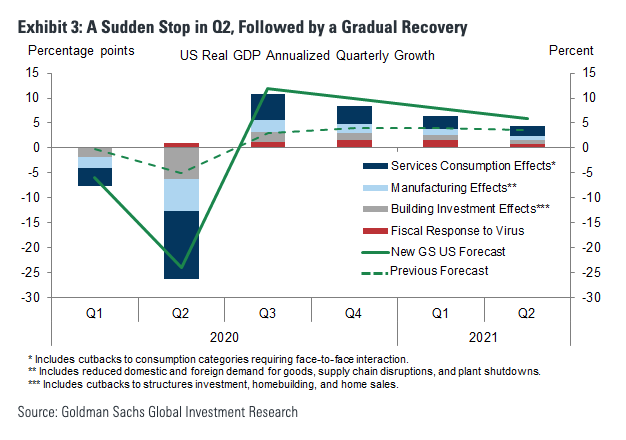
This assumes somehow few businesses and consumers bankruptcies, not currency crisis following helicopter money from central banks, or any other major financial issues related to the COVID-19 shutdown. How likely is that I'm not so sure, but this was the view of Goldman Sachs around a week ago with a 24% GDP drop in Q2 in the US, followed by +10% in Q3, and +8% in Q4 with the full year down 3.8%.


That would be a short recession, but considering how the US stock market was extended in February 2020 (and still is), problems are likely to linger much longer in the US, and many other countries.

Viruses are also interesting creatures, and earlier this month, we tried to look at the 1918-1919 Spanish flu to understand the economic and market impact of the novel Coronavirus, and we posted this chart representing the numbers of death per 100,000 in the UK at the time.

Viruses come in waves. It started in June-July 1918, then dropped until around early October, before coming back with a vengeance until the end of December with a small retrieve in January, before the last wave topping in in March 1919 before ending at the end of May 1919.

If this pattern occurred again that would be mean on and off lockdowns over a 10+ month period in each country, meaning nearly 12 months of lower economic activity worldwide, and the greatest depression we've ever seen. I have no clear idea what the world would look like in that case but there would be a low economic activity, out of control money printing, resulting in inflation down the road especially if they keep giving money directly to citizens also called MMT (Modern Monetary Theory) leading to the inflationary depression touted by Peter Schiff, at least in the US and the western world.

How will it exactly pan out? We just don't know, nor does anybody and only time will tell, but everybody should be aware of the risks and prepare at best as they can.

Sunday, March 15, 2020

Overvalued Markets (March 2020) - Top 10 Countries

Last week we wrote about the top 10 undervalued stock markets using data from StarCapital AG. Data is up-to-date as of February 28th, 2020, and markets went through interesting gyrations in the last two weeks, to say the least.

But let's go ahead anyway with a list of the top 10 overvalued markets based on metrics such as CAPE (Cost Adjusted Price Earning Ratio), average dividend yield, price-to-book ratio, and price-to-sales-ratio.

Here's the list of the top ten most undervalued markets as of March 2020.


Indonesia was the most expensive at the time, followed by the United States, India, New Zealand, Denmark, as well as Australia, Brazil, the Netherlands, Belgium, South Africa, and Switzerland. Most have experienced a sharp 20 to 30% drop in the last two weeks, Let's have a look at the 10-year charts of the largest markets, namely the United States, India, and Australia, using Trading Economics as the source.


The S&P 500 has a CAPE of around 28 before the drop. It went down as low as 2,400 points this week but ended the week at 2,711 points. Even with the drop of around 20%, the CAPE is still well over 20 historically speaking is considering to be overvalued for the US market. To get into undervalued territories, we'd have to go with a CAPE of under 10 which means the S&P 500 under 1,000 points at current levels. Note earnings are likely to sharply drop in the next quarters due to the reaction to the coronavirus outbreak.


 Another way to look at the long term valuation of the stock market is to check the valuation against the GDP. The Whilshire 5000 to GDP ratio (source: longtermtrends) is around 1.2 right now well above the historical average of ~0.8. If we ever went back to the ratio reached in 2009, the S&P 500 would be around 1,200 points.


Moving to India's stock market with the 10-year chart of the SENSEX shows the recent drop in perspective with the market still doubling since the lows in 2012. If we look at the 2008 lows when the SENSEX was at around 9,000 it nearly quadrupled in 12 years. If earnings grow at that pace that's not an issue, but the rise was also due to an expansion to the price-earning ratio which led to the overvaluation of the market.


The Australia S&P/ASX 200 stock market index does not look as extended as the other two. The CAPE was 18.7 at the end of February, and the sharp drop have brought it down just under 15. We don't have historical information about the Australian CAPE, but it's clearly not in undervaluation territories. Another measure to look at is the PB (Price-to-Book) ratio which was at 2.0, and undervalued markets are often around or even under 1. 

It normally takes one to two years for a bear market to bring valuations to fair value or undervalued, and Charles Nenner, a market cycles specialist, expects markets to bottom out at the end of 2021. Note that shorting stocks may be very risky due to the central bank involvement in markets (if they print enough, stocks will go higher no matter what), and purchasing bear ETFs often have very high associated costs.

Despite globalization, not all markets move in unison and some of the undervalued markets we pointed out last week start to have interesting valuation although it may pay to be patient. I'd see further weakness in Russia, Singapore, Austria, and South Korea as a potential buying opportunity once the situation with the Coronavirus become a little more clear.


Sunday, February 16, 2020

Financial Fraud: AirBnB and Virgin Hyperloop One Pre-IPO Scams

You may have read in the news that fairly large private companies like AirBnB and Virgin Hyperloop One may consider launching an IPO (Initial Public Offering). Some scammers have decided to make a buck and launched several websites, opened companies across the world in 2019, and set up call centers.

[Update June 2, 2020: The scammers have also diversified their stock offerings with scams now also involving:

PRMW - Primo Water Corporation
ZM - Zoom Video Communications, Inc.]

How Does that Work?

The scammers manage to get your phone number, name, and email address from sources that may include a website where you have expressed your interest.

A person speaking perfect English and that sounds knowledgeable with financial matters then calls pitching the unique opportunity to invest in Virgin Hyperloop One IPO (actually Pre-IPO), for instance. Most people will be wary, but then they provide you with a credible company website, including registration numbers from the Bank of Ireland that seem to match, and some information about the IPO. They let you some time to think about it, and then come back the next day where they can complete the deal.

You'll then receive an email with account opening documents, online account access, invoice for the amount you want to invest in, and of course, the W-8 form since the IPO takes place in the US. You'll talk to another employee/scammer to confirm your details. Note that we were told you'll never be asked your passport, a clear red flag.


You'll notice the company where you're asked to pay the invoice to is different from the company promoting the pre-IPO, but they'll tell you it's safer to use a third-party as Escrow to confirm payment for both sides. It's also in a different country.


Once payment is received, you'll get an official receipt, and can log into your account, and your shares will be visible. They'll then call you from time to time, maybe once to twice a month to explain everything goes well, and the IPO should occur in Q1 or Q2 2020 as expected. One day, a call is different, as they'll pitch another stock with a unique opportunity of a positive liquidation scheduled to close in about 45 days. You'll buy some shares now, and in 45 days you more than double your investment. This is a unique opportunity, does not happen very often, and is basically risk-free.

If you decide to invest again, and then be contacted from time to time to keep you updated, and when the time to sell has come, they'll call you to inform you there are some options to purchase for a fraction of the price, and you'll quadruple your initial investment. If you refuse, they'll come back a few days later, saying the sale is complete, and provide with an obviously fake NASDAQ receipt (PDF generated from Excel file) saying you need to purchase mandatory preferred shares to release the funds.


Fake Companies/Websites/Names, Real Companies, and Bank Accounts

So who are those people? We don't exactly, but we do know they are using possibly fake companies, fake names with the phone scammers having some heavy turnaround, as well as real companies that opened last year and are used to funnel the money.

"Fake" companies & websites used:

Van Gossum Consult (“VGC”) 


Singapore: One Raffles Place, Tower 2, 1 Raffles Place #27-62 S048616 London: 110 Bishopsgate, London, EC2N 4AY Hong Kong: International Finance Centre, 8 Finance Street, Central, Hong Kong 

St Johns Asset Management (“SJAM”). 

website: www.stjohnsasset.com

Office#: 386-385-5915
Address: 601 St. Johns Avenue Palatka, FL 32177, USA

Crest Security Contracts Ltd

The company was related to the two other companies listed above and has now alledgedly closed due to a lawsuit.

Brookfield Investment Funds Plc 

website: brookfieldinvestmentfundsplc.net
main email: accounts@brookfieldinvestmentfundsplc.net

Office addresses:

Others

You'll find many others companies related to AirBnB pre-IPO scam. Luxstar Asset Management, based in Luxembourg, specifically asks payments to Kaloca Inc, for which we have more details below.

We know of three companies and bank accounts used to transfer funds, but there may be more:

Account Name: VIPCO Holdings Pte.Ltd.
Account address:
11 Keng Cheow Street
No. 02‐11 Riverside
Piazza
Singapore 059608
Account Number: 503 534 950 301
Bank Name: OCBC Bank Singapore
Bank address:
65 Chulia St.,
OCBC Centre,
Singapore 049514
Swift Code: OCBCSGSG

Incorporated in February 2019.

Account Name: Law Office: John Jennings
Account Address: 40213 Duesseldorf, Germany
Account Number: DE34 7001 0080 0097 3868 04
Bank Name: Postbank
Bank Address: Essen, Germany
Swift Code: PBNKDEFF

Very hard to find information about that one. It looks like an individual, instead of a law office.

Account Name: KALOCA INC.

Account Address:
2177 Buckingham Rd.,
Suite 567,
Richardson, TX 75081
Account Number: 4880 7336 0881
Bank Name: Bank of America
Bank Address:
100 N. Tryon St.
Charlotte, NC 28255
USA
Swift Code: BOFAUS3N
ABA/Routing Number: 026009593


The company was incorporated in 2019.

Some of the (likely) fake names and positions of the scammers include:

Mr. Jason Taylor, Investment Adviser
Carl Bryce, Director of Finance
Damian Williams, Director of Mergers & Acquisitions
David Billington, Accounts Department
Keith Armitage, President
Greg Ellis, Account Services.
Ian Simms, Senior Market Strategist
David Scott, Finance Manager
Daniel Parker, Investment Advisor
Melissa Keating, Accounts

Some of the phone numbers used to call victims: +35314126374, +35314124540, +44(0)1702623754, +442076601459, "private numbers", and local phones numbers which all have called barring enabled meaning they can call you, but you can't call back

I've been scammed! What can I do?

First, stay calm, and if they call you again just pretend you are still interested, just in case the police need more information. You could also install call recording apps such ACR call record provided it's legal in your home country.

Then fill a report to your local police station. You could also fill a report to the authorities of the country where you transferred the funds.

For VIPCO Holdings Pte. Ltd. in Singapore, you can fill a report online to the Singapore Police Force using their iWitness website. Alternatively, you could call the Commercial Affairs Department directly: +65 6325 0000.

For "Law Office: John Jennings" in Germany or other countries in Europe, you can follow the links from Europol website.

For KALACO Inc. in the US, you could contact the FBI in one of their offices in the US or overseas.

You could also contact a lawyer, but this would likely only work if the amount is really significant. Working on international cybercrime is a complex and slow process with the involvement of the authorities of multiple counties, certified translations, bank records, lots of documents and so on.

SafeorScam website also reported on such scams, and they offer services to help to recover the funds. However, we never worked with the company, and can't vouch for them, just make sure not to throw good money after bad.

To be honest, the chance of recovering funds is slim, as the money probably left the country where the money was transferred and spent on third parties. But it still worth a try, and the people responsible for the scam must be held accountable and spend a few years in jail. This will also prevent more victims.

Saturday, December 15, 2012

GEAB 70 - 2013, The First Steps into The "World Afterwards" in Complete Chaos

Here are the highlights of GEAB 70 (December 2012) entitled "2013, The First Steps into The "World Afterwards" in Complete Chaos":

  • 2013, The First Steps into The "World Afterwards" in Complete Chaos - As the world enters into a global recession in 2013, it will become more fragmented into regional blocks. Although  the Euroland, South America and Asia should come strengthen from the crisis, the US, the United Kingdom, Israel and Japan should be greatly weakened.
  • Politics in Germany until 2017 – Weaking of main political parties, and increase in the number of small parties.
  • Yearly evaluation of LEAP anticipations – 75% success rate en 2012. By their own assessment, before new anticipations are published in GEAB 71 next month.
  • Global systemic crisis: Assessments of 40 « country-risks» - LEAP 2020 team looks into 40 countries, and how they are likely to handle the 2013 crisis.
  • Strategic and operational recommendations. Stock markets are likely to slide downwards, banks will suffer and it may be wise to spread assets among several banks,  prudence is required when investing in real estate, and keep stocking up Gold.
  • The GlobalEurometre - Results & Analyses. 66% (vs 48% in November) of respondents experienced price increases..
The full GEAB 70 report (PDF format) is available to LEAP 2020 subscribers for 200 Euros per year for 10 new issues + the 6 issues published before registration.

Saturday, December 1, 2012

Marc Faber December 2012 Market Commentary

Marc Faber has just released his December 2012 market commentary "Always try to be a little kinder than Necessary" on gloomboomdoom.com.

This month report explains that something is clearly not quite right with the economy, as the recent performance of Wal-Mart, Tiffany, Genesco, and Kohl’s show. What concerns Marc Faber greatly is that most asset markets had outsized gains since early 2009, excluding Vietnamese, Chinese, Japanese, and European equities, as well as US housing. He believes that investors’ expectations about future returns are far too optimistic, and that in a world that currently hardly grows, investors will need to reduce their future return expectations. Therefore, 2013 will most probably not be a good year for holders of assets, and he has now shifted to the preservation of the outsized gains he has achieved over the last 3 years.

Marc Faber also wishes Merry Xmas to everybody and reminds his readers to try to be as nice and kind to other people quoting Albert Schweitzer: "Constant kindness can accomplish much. As the sun makes ice melt, kindness causes misunderstanding, mistrust, and hostility to evaporate." 

The monthly market commentary including one attachment:
  • The Fed’s Last Hope by Michael A. Gayed,Chief Investment Strategist at Pension Partners, LLC.
I cannot find the attachment, but Gayed mentions it in a marketwatch.com articles, and explains bonds have now very little value, and the relative advantage of dividend yields over bonds yields, will be bullish for stocks.

If you want to access the full Monthly Market Commentary (MMC) by Marc Faber, it is available for 300 USD per year.

Thursday, November 15, 2012

GEAB 69: Katrina-Sandy : From one Storm to the Other, the End of America as we Knew it

Here are the highlights of GEAB 69 (Novenber 2012) entitled "Katrina-Sandy : From one Storm to the Other, the End of America as we Knew it":
  • Katrina-Sandy : From one Storm to the Other, the End of America as we Knew it - The LEAP team has a controversial view that says Sandy, a small storm that has put New York to its knees, has shown that America has greatly weakened, and that it's the country we once knew anymore. In this section they also address the political division of the US and its dire financial & economic situation.
  • 2013, the king is naked: The great geopolitical dislocation of America. - The US economy is slowly but surely weakening, and 2013 will be the year of the real crisis where the "dollar wall" will collapse.
  • China 2013 : The global riot laboratory - A view of riots in China, and their consequences.
  • A Canadian Tragedy – The Slump of its Real Estate Market - Contrary to the view of Canadian banks who see a market stabilization, LEAP believe the recent slumps in Toronto and Vancouver announced the popping of the Canadian real estate bubble.
  • Strategic and operational recommendations. Currencies may remain irrational for a little longer, it's not to late to escape from the stock market, get physical Gold and do not play short term trades, energy commodities are better for the long term, but may suffer in the short term, and it's really not a good time to invest in Canadian real estate..
  • The GlobalEurometre - Results & Analyses. Only 65% of respondents expect the dollar to go down, which is the lowest figure since the survey started.
The full GEAB 69 report (PDF format) is available to LEAP 2020 subscribers for 200 Euros per year for 10 new issues + the 6 issues published before registration.

Thursday, November 8, 2012

Ron Paul: The US is Broke and Already Over Fiscal Cliff

Ron Paul is interviewed on Bloomberg about the US presidential elections.

He explains that the US is broke, it already passed the fiscal cliff, and we reached a point of no return. I completely agree with this statement, and this has nothing to do with politics, it's just Maths, which most voters in the US and other "developed" economics do not seem very good at. That's actually frightening that only 1% of US voters seem to get it.

He carries on to say the problem is with the people, who just want more bailouts (and that's true both for poor, the middle class and the richest 1% of the US population). He gave the auto industry bailout as an example, and said the people in the Midwest did not vote for Mitt Romney because he had opposed the government bailout of General Motors and Chrysler. In that respect, the US is just the same as Greece as people do not wan  to cut anything, yet Greece is criticized and laughed at in the US.


Sunday, June 10, 2012

Barron's Midyear Roundup: Marc Faber Markets Outlook

Now is the time for Barron's Midyear Roundup. They had 10 experts on their panel including Marc Faber. Here are Marc Faber's picks.

Investment/Ticker Price 6/6/12
Gold (spot, per ounce)$1,619.30
Goldcorp/GG40.24
Singapore REITS
Mapletree Comm Trust/MCTS$0.92
Frasers Centrepoint Trust/ FCT1.63
K-REIT Asia/KREIT0.98
Mapletree Logistics Trust/MLT0.98
Ascott Residence Trust/ART1.06
Cache Logistics Trust/CACHE1.03
Parkway Life/PREIT1.81

and what he had to say:
Are things really as bad as they look?

FABER: The global economy has slowed considerably. Europe is in recession, and growth in U.S. GDP might owe more to statistical aberrations than reality. In Asia, the Chinese economy has been decelerating sharply, which impacts China's trading partners and industrial commodity prices. Lower demand for commodities hurts commodity producers, whether in Argentina, Brazil, Africa, or Russia.
Will things get worse before they get better?
Yes, possibly much worse. Central bankers will argue that more stimulus is needed. But the crisis has occurred in large part because governments have grown excessively large. The private sector produces growth. When government is 40%, 50%, 60% of the economy, the economy won't perform well. If you cut government spending meaningfully, you produce more growth, although this can be painful in the near term. Canada took this course in the mid-1990s. The outlook is grim for the federal deficit in the United States. Regardless of who wins the election, there will be compromises. But spending cuts will be back-end loaded and tax increases will be postponed. We won't see a federal deficit below a trillion dollars for a long time.

What will the stock market do for the rest of this year?
Most markets peaked in May 2011. The S&P 500 fell to 1,074 by Oct. 4 from 1,370. Then we had a strong rebound with the index making a new high at 1,422. This high wasn't confirmed by other indexes, such as the Value Line Index, the Russell 2000, and the Dow Jones Transportation index. The S&P 500 is vulnerable at this level. I anticipate further weakness in the second half of the year. Corporate profits will disappoint. Some 40% of S&P 500 earnings come from overseas, and a large proportion are generated in Europe.
There is no resolution to the problem in Europe because no one wants to accept austerity. The best outcome for Greece probably would be to exit the euro zone. But the new Greek drachma would depreciate by 50% to 70% against the euro. The Greeks don't want their pensions paid in a depreciating currency. Nor do they want austerity, as their pensions and government salaries would be cut by 50%.
How will the stalemate end?
The breaking point could be three, four, five years away. The world is heading toward a major crisis. In the meantime, central banks can continue to print money and markets might move up. Since 2009 stocks around the world have more or less doubled. But the economy hasn't performed well, and the typical household hasn't been helped. With quantitative easing, money flows into the hands of relatively few people. I am very negative about the outlook longer term.
It is safest to buy U.S. Treasuries because the U.S. can print money. It will pay the interest. But you are earning only 1.6%, and the cost of living is increasing by about 5% a year around the world. You are getting a negative real return.
So you're recommending equities, despite the poor backdrop?
I still like my January investment picks. As a group, Singapore REITS look OK. Among them I like Mapletree Commercial Trust [MCT.Singapore], Frasers Centrepoint Trust [FCT.Singapore], K-REIT Asia [KREIT.Singapore], Mapletree Logistics Trust [MLT.Singapore], Ascott Residence Trust [ART.Singapore], Cache Logistics Trust [CACHE.Singapore] and Parkway Life [PREIT.Singapore].
I am also warming to gold shares. Gold corrected to $1,522 last December from $1,921 in September. It rebounded to $1,795 in February and is back down around $1,600. The correction could last longer, but given that governments will print more money, gold is relatively effective as a currency. My preference is physical gold, but I would also own some gold shares, which have been decimated. Goldcorp [GG] is attractive because most of its properties are in the U.S., Canada, and Mexico. The company isn't exposed to regimes that are talking about nationalizing resources. In general, stock markets are oversold. The U.S. government-bond market is overbought. The U.S. dollar is overbought, and gold is oversold near term.

 Source: http://online.barrons.com/article/SB50001424053111904470204577446414018834948.html

Wednesday, May 2, 2012

Jim Rogers: The Next Recession (2013,2014) Will Be Much Worse

Jim rogers is interviewed on Business Insider by Henry Blodget on May 2, 2012.

He explains that because of the increase in debt, the next economic downturn will be much worse. We had a recession in 2002, then 2008 and the next one cannot be far away and should probably  occur in 2013 or 2014.

There is a lot of good news currently because we are in an election year and the government and the federal reserve are spending a lot of money, and the government statistics are massaged to make the economy look better than it really is. But in reality, the situation is getting worse, because the debt is getting much much worse.

Most people agree that the US is in relative decline against the rest of the world, but Jim Rogers also thinks the US in absolute decline as it is the larger debtor nation in history, and the country is over extended militarily over the world.

He concludes on a positive note by saying he's very bullish on agriculture in the US, and farm land is nowhere near a bubble yet.

Thursday, April 12, 2012

Investing in Natual Gas Revisited - FCG ETF

I've been keen on investing in natural gas for well over a year, and the timing hasn't been right until now. But with natural gas spot price dropping below 2 dollars per million British thermal units (MBTU) yesterday, and hitting a 14-year low, I thought I might deal with this investment idea again.

First let's make the case for investing in US natural gas.


The best time to buy commodities is when they are depressed. Let's have a look at US natural gas for the last 15 years (Source: IndexMundi.com)

The price is now back to 1997/1999 levels, right before the start of the massive commodities bull market and massive monetary inflation by central banks do not appear to be affecting natgas price.

If you think a 15-year low might be a good investment opportunity, what about an inflation adjusted 36-year low?
Source:Our Finite World
This chart was updated in January 2012, when natural gas was still above 2 USD per MTBU and it has since dropped to 1.98 USD per MBTU, so we are at least at a 36-year low (or very close to it) when adjusted with official inflation numbers.


Pundits explains the price is low because of the glut of natural gas attributed to new technologies such as fracking, and this is certainly a very good point. But there is another aspect which is very bullish for US natural gas: international gas market. Russian natural gas and Indonesian LNG are still in a upward trend, and currently Russian natural gas is over 6 times more expensive than US natural gas as shown in the 15-year charts below (Source: IndexMundi.com).

Russian Natural Gas (1997-2012)

Indonesian LNG (1997-2012)
Natural gas is not has easy to transport as crude oil for example, but one of the issue is the lack of LNG terminal with the ability to export liquefied gas to international markets which would increase the price of natural gas in the US and help decrease the cost of natural gas overseas. According to Wikipedia, there is only one liquefaction terminal (for export) in Alaska for the whole US, but there are 13 regasification terminals (for import). There are 2 proposed liquefaction terminals in Louisiana and Oregon. Once completed, the US will be able to export more natural gas and hopefully take advantage of the differential between local and international prices.

Finally, Crude Oil (WTI) to Natural Gas price Ratio stands now at over 50, whereas the historical norm has been around 8 to 10. See chart below (Souce: stockcharts.com)

So that means for a given amount of energy natural gas is about 5 times cheaper than crude oil. In reality, this is obviously not that easy as those 2 fuels are not interchangeable, but companies may start to invest more in power plant and transportation that can accommodate natural gas.

Now we have made the case to invest in natural gas, let's see how it can be done


There are some ETF to invest in Natural Gas such as UNG (USA) that are supposed to track natural gas price. However, their cost (due to diverse costs and contango) is prohibitive so that I would really advise against investing in those, unless you are able to correctly guess the price of Natgas within 3 months. Those types of ETF will go to zero by design.

You could potentially invest in companies such as Chesapeake or SandRidge Energy (SD), but if natural gas stays too low for too long some of those companies may go bankrupt and you'd lose all your investment. If you have enough capital, you could buy a list a companies involved in natural gas extraction and exploration, but for most of us, the simplest is to invest in mutual funds or ETF.

First Trust ISE-Revere Natural Gas Idx (FCG) is an ETF tracking ISE-REVERE Natural Gas Index which is composed of the stock of companies dealing with natural gas production and exploration.

Let's see how FCG fared in the last five years (Source: Yahoo Finance).
The first obvious thing is that it tracks natural gas rather poorly. FCG followed the price hike in 2008, but since 2009 it has more or less tracked the performance of the S&P 500. This makes me a little uneasy to buy FCG right now, but in case of further weakness (at least  below 15), it might be interesting to start buying this ETF to have some (limited) exposure to natural gas.

I'm not fully satisfied with this method of investing in natural gas, but it's the best I've found so far. If you have better ideas, let me know.

I've also seen some companies are selling Oil and Gas Royalty Rights, but I have not checked this into details yet, as it may not be easy to access such investment for oversea investors.

Tuesday, April 3, 2012

Marc Faber: Inflation or Deflation ?

Marc Faber is interviewed by Lauren Lyster's Capital Account on Russia Today on the 3rd of April 2012.

Marc Faber says inflation in money and credit can cause bubbles, but it is hard to know where they are, and it is not easy to know where inflation is taking place. He also notes that governments hide inflation and much of that inflation goes into asset prices. We do not know exactly how much the Federal Reserve, the ECB, the BOJ, etc. are propping up the prices of stocks, commodities, etc. We can only estimate. The money printing and loose language of the central bankers and policy makers around the world certainly does distort the price mechanism, however, and Marc Faber is not optimistic about the ramifications of these actions.

He also mentioned the quadrillions in derivative, and that derivatives bubble will eventually collapse and lead to massive wealth destruction.

When asked to give advice to young people in their 20s and 30s, he referred to his generation and how it was easy to get a job at the time, but since the collapse of communism and the advance of the internet, 3 billion persons entered the world economy and western youngster have a lot of competition by young people living in developing economies, so he just think young people should lower their expectations and people in the western world should change their mentality and reject the nanny state.

 The interview starts at 3:18.

Saturday, March 17, 2012

The Next 20 Years: Inflation vs Deflation

Steve Keen, an Australian economist and contrarian strongly opposed to neo-classic economists views, has recently posted an article entitled "Economics without a blind-spot on debt" where he discusses the importance of private debt during the great depression and now.

He managed to gather the data for aggregate private debt in the US and Australia and drew the result in the chart below:
There was a debt bubble in the 30s which led to the great depression, and now it appears we have the same kind of bubble, only more pronounced. The main difference is that now we live in a world of fiat currencies and what happens next is highly depending on monetary policies.

I encourage you to read his blog post for details about private debt. I'm going to focus on 2 scenarios:
  • Deflation where the central banks do not really fight the debt deflation (or debtflation).
  • Inflation where the central banks decide to keep the aggregate private debt constant and works thru the years via inflation.
If we consider 150% of GDP to be a normal level of aggregate private debt then the debt bubble started around 1987 and peaked in 2010 (a 23-year debt increase). Historically, bubbles have a tendency to be somewhat symmetric, so in the case of debt deflation let's assume it to last 23 years that is until 2033, or about 20 years from now.

In this scenario, there would be massive deflation, and, in theory, the preferred asset would be cash (under the mattress) and many companies and banks would have to go bankrupt, but in reality, the system would probably have to collapse, and I'm not so sure what the value of cash would be. This is the kind of scenario envisioned by Robert Prechter who sees the Dow Jones at 1000 USD.

The other scenario (flat private debt to GDP ratio) would assume massive money printing. Let's assume somehow the federal reserve can keep this ratio constant by printing money during 23 years. If the GDP growth is flat, it would require about 3% (extra) inflation per year. However, during that period, there is actually a good chance of negative growth because Peak oil consequences will be in full effect unless we find some energy alternatives. This also excludes public debt and unfunded liabilities (about 100 trillions USD or 600% of GDP) which would require inflation north of 10% to get monetized.

If you think the US is in bad shape, just look at the aggregate private debt in the UK in the chart below. This country (and the British pound) are going to have a very rough time in the years and even decades ahead, as its private debt stands at 450% of GDP.
You may also want to read "Currency Crisis:Why is the British Pound a doomed currency ?" for a more detailed analysis of the United Kingdom debt and upcoming GBP currency crisis.

Thursday, March 15, 2012

GEAB 63: Global Systemic Crisis: The 5 Devastating Storms of Summer 2012 at the Heart of the Global Geopolitical Dislocation

Here are the highlights of GEAB 63 (March 2012) entitled "Global Systemic Crisis: The 5 devastating storms of summer 2012 at the heart of global geopolitical dislocation":
  • Global Systemic Crisis: The five devastating storms of summer 2012 at the heart of the global geopolitical dislocationGlobal recession, debt crises, stock market crashes, potential war with Iran.
  • Summer 2012: The US falls back into recession as Europe stagnates and BRICs slow down. LEAP 2012 predicts a global recession in 2012.
  • Summer 2012: Central banks roadblocks and the rise of interest rates. The US federal reserve must now manage two new problems: the lack of demand for US treasuries and the rise of two other currencies: the Euro and the Chinese yuan.
  • Summer 2012: Storm on currency markets and western public debts. After several attempts to stabilize exchange rates over the last few quarters, the failure to come to an agreement for a new currency at the G20 in order to build a new monetary system will lead to more currency volatility and further debt crises in western economies.
  • Summer 2012: Iran, the war "too many". Whether this war occurs or not, it will be the war too many for the western world.
  • Summer 2012: The new stock market and financial institutions crash. Iran's allies, such as China, are likely to hurt Washington financially by diversifying US dollar assets into other currencies.by announcing with Moscow that they will stop buying US treasuries in order to stop the US war machine.
  • 2015: "The great fall of western real estate" - Excerpt of the chapter on the evolution of US residential real estate. As the US manufactures less and less, the country will become poorer and accelerated the fall of American real estate.
  • Strategic and operational recommendations. Consequence of the emergence of 3 main monetary zones (US Europe and China). Inflection point for Gold. Commodities: conflict vs recession. End of the illusion for the US economy. Orange alert (whatever that means) on financial products..
  • The GlobalEurometre - Results & Analyses. 85% of respondents think of European governance is being put into place.
The full GEAB 63 (PDF format) is available to LEAP 2020 subscribers for 200 Euros per year (10 + 6 issues).

Wednesday, February 15, 2012

GEAB 62: Euroland 2012-2016 : Perennisation of a New Global Power Contigent On Democratization

Here are the highlights of GEAB 62 (February 2012) entitled "Global Systemic Crisis: Euroland 2012-2016 : Perennisation of a new global power contingent on democratization":
  • Global Systemic Crisis: Euroland 2012-2016 : Perennisation of a New Global Power Contingent on Democratization. The Euroland will come out stronger of the crisis as long as people are involved in the Euroland project (and not just technocrats).
  • 2013 : End of the US Dollar Supremacy in Global Commercial Transactions. The decreased amount of commercial transactions in US dollars will be the main trigger of the demise of the dollar, not USD currency reserves by foreign powers.
  • 2015 – The Great Slump of Western Real Estate. LEAP 2020 forecasts important price correction for real estate in western economies by 2015. (Excerpt from a book to be published in March 2012)
  • January 2012 GEAB $ Index: The US dollar accelerates its loss of value against the currency basket €, ¥, Ұ et R$.
  • Strategic and operational recommendations. Many currencies will fall sharply, mind where you keep your Gold, solutions for Greece, winter stock market returns were a travesty and the coming great collapse of Western residential real estate.
  • The GlobalEurometre - Results & Analyses. 69% of respondents (vs. 58% in January 2012) expect an important fall in the value of the US Dollar in the coming months.

The full GEAB 62 (PDF format) is available to LEAP 2020 subscribers for 200 Euros per year (10 + 6 issues).

Tuesday, January 31, 2012

Jim Rogers: Politicians Want To Fool Us This Year

Jim Rogers is interviewed by CNBC on the 30th of January 2012.

They firstly talk about bank bonuses, then about prospects for US and Europe in 2012. Jim Rogers is not worried about the Euro this year, because of the elections around the world, which will lead to more printing by the central banks and more spending by politicians.


Tuesday, January 17, 2012

2012 Recession Likely

A recession in the US is likely according to indicators used by John Hussman of Hussmann Funds and the WLI (Weekly Leading Indicator) growth by the ECRI.

John Hussman created a chart (below) corresponding to the average of standardized values (mean zero, unit variance) of the following variables:
  • 6 month change in S&P 500
  • 6 month change in nonfarm payrolls
  • 12 month change in nonfarm payrolls
  • 6 month change in average weekly hours worked
  • ISM Purchasing Managers Index
  • ISM New Orders Index
  • OECD Leading Indicator - total world, 
  • OECD Leading Indicator - US, 
  • ECRI Weekly Leading Index growth
  • Chicago Fed National Activity Index 
  • 3 month average, credit spreads (Baa vs 10-year Treasury), 
  • Industrial commodity prices - 12 month and 6 month change
  • New building permits 6 month change.
Here's the chart between 1952 and 2011.


The level we currently get (-0.5) has always been associated with recessions, except with the false positive in 2003, right after the 2001/2002 recession. It correctly predicted or coincided with 10 recessions, never missed one and gave one incorrect signal as previously mentioned.
The WLIG currently stands at -8.4 (6 Jan 2012), a level usually associated with recession. ECRI insists however they use other leading indicator to make a recession call. That's why they did not make a recession call in 2010, but did make one for 2012.

There is now a fair amount of optimism in AAII survey (~50% bullish), although its' not extreme yet, and lagging indicators give a positive outlook for the US economy, so those recession calls still have many critics, but I believe they will eventually be proven right this year.