Showing posts with label us. Show all posts

Monday, February 4, 2013

S&P 500 Analysis: Valuation, Sentiment and Technicals - February 2013 Update

Last time I did this analysis was in January 2012, and I found out the US market was not particularly attractive with the S&P 500 just over 1,300, but not extended quite enough (AAII sentiment) to short it, the S&P 500 is now over 1,500, so let's update this long term analysis.

S&P 500 Valuation

The Shiller S&P 500 CAPE (10-year price earning ratio adjusted for inflation) is the reference to assess whether the S&P 500 is undervalued or overvalued over long periods of time. Here's what it looks like now:


The CAPE stands at 22.77 vs 21.14 over a year ago, so by this metric the S&P 500 is even more overvalued than last year. Although it's still much lower than the CAPE in 2000, it's still high compared to historical CAPE, and at the level of previous tops in the stock market (1901, 1929 and 1966).

Many analysts like to look at the short term, and show that forward PE ratio is only about 14, and use this number to explain stocks are a pretty good bargain right now. In 2007, we had the same rhetoric, as forward PE was low because of high corporate earnings, which were widely above their long term trend.
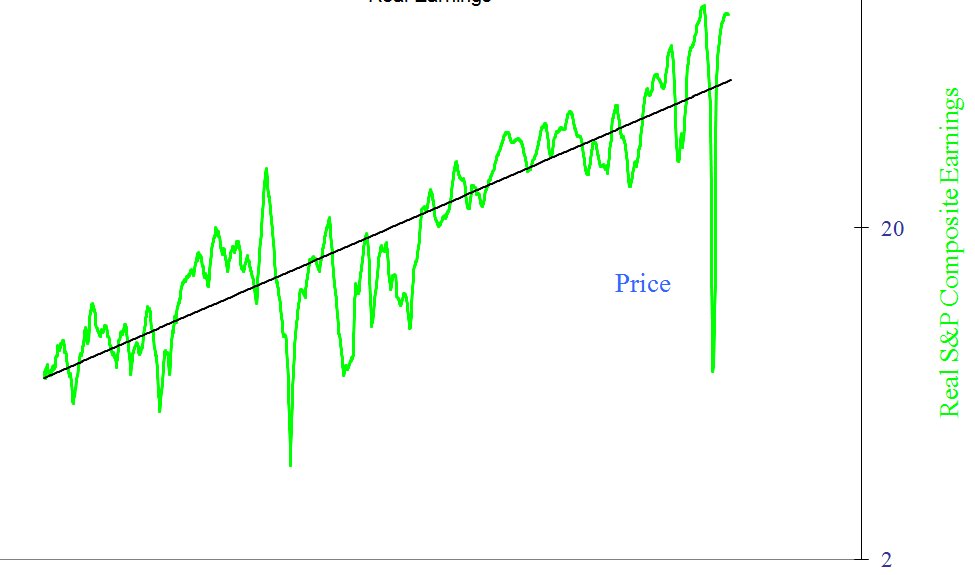
The chart above shows the S&P 500 earning adjust for inflation (real earning) between 1870 and today. We are clearly above trend, and this does not bode well for future returns.

Based on the 2 metrics above, the conclusion is the same as last year and it appears that based on valuation investing in the S&P 500 for the next several years might not be the best of ideas, or least it's rather risky.


US Market Investors Sentiment

Based on last week AAII sentiment survey, investors are moderately bullish for the next 6 months.
But I like to look at the 14-week moving average of the AAII sentiment survey (which I call AAII-14), since I found it to be useful to identify  some of the optimistic (and market) peaks of the past. The rule goes as follows: If the 14-week moving average of the AAII "Bullish" sentiment index is at 30% or below there could be a long term buying opportunity, above 50% there could be a long term sell opportunity.


Now this is getting interesting, as sentiment is pretty bullish, and AAII-14 getting closer to the 50% mark, even though it's not quite there for now.

S&P 500 Technicals

We are now going to have a look at some technical indicators namely RSI-14 and NYA200R, as well as draw trend lines on the S&P 500 to see what it might do in the short term.


The chart above (Yahoo Finance) is the 6 month chart of the S&P 500 with RSI-14, and we've been around 80 for a little while, which means the market is overbought in the short term.

NYA200R shows over 83% of stock are above their 200-day moving average, which is  not very bullish for stocks either
Now let's get back the S&P 500 chart, but this time over 5 years, and let's try to draw bottom and top parallel trend lines.


We seem to have reached the top of the trend started since 2010, so a correction (at least in the short term) could occur very soon.

Conclusion

In the short term, all indicators shown above are bearish since they all indicate the market is overbought, so it's prudent to own less US stock at the moment, and traders may also consider shorting for the next few weeks/months.

In the long term, the S&P 500 is overvalued by all measures, but market participant is not extreme just yet, so there could be a short term correction, followed by a rally before stocks head south for a longer period of times. Alternatively, it's also possible positive sentiment carries on the S&P 500 to new highs, and the long term reversal comes earlier than expected.

Monday, January 21, 2013

Long Term Charts Thai Stock Market - January 2013 Update

This is a repost of the article found on CNX Translation forums.

6 months have gone since our last update, and its time again to update the long term charts of the Thai stock market.

The first chart is the SET index between 1975 and January 2013. Following other indices around the world, and despite my overvaluation view 6 months ago, the Thai stock market has continued its (unstoppable) rise in the last 6 months, and now stands at about 1440, a rise of about 40% since I started to become cautious.

Image

The PER is now around 18, mainly due to the stock market improvement. At 15, I started to be bearish, so at 18 it's extremely unusual for the Thai stock market. So either earnings have to go up substantially, either the stock market has to plunge, or a combination of the two.
Image

The price to book value slowly crept up to 2.4 which also starts to make Thai stocks overvalued, especially compared to what you get in other markets around the world. (European stocks have a P/B ratio around 1 now)
Image

To conclude, I believe the Thai stock market is relatively overvalued both historically, and compared to other stocks markets around the world. The dividend yield is now around 3% which is is that more than can get in a fixed deposit (Bangkok Bank now offers up to 2.65 % p.a for a 36 months fixed deposit), so why take the risk? There is also a lot of optimism around the world, which IMHO is not warranted, so I would not be surprised to see a massive correction in the Thai stock market within the next year.

Wednesday, November 21, 2012

GMO 7-Year Asset Class Forecasts - October 2012

GMO has released its monthly 7-year Asset Class Forecasts and since many markets have been pretty stable all year, the story remains more or less the same:

  • US Large caps: 0.3% per year
  • US Small caps: -0.2% per year
  • US High Quality: 4.8% per year
  • International Large caps: 4.8% per year
  • International Small caps: 4.2% per year
  • Emerging Markets: 6.3% per year
Avoid US stocks, except high quality, and emerging market stocks should offer the best returns. Obviously, all emerging markets are not created equal. The Chinese stock market which is very depressed is likely to return more than the Thai and Indonesian stock market for example, which seem really resilient at the moment with relatively high valuations.Most bonds, excluding Emerging debt, are still a terrible investment for the next few years according to GMO methology.

You can receive GMO's forecasts (monthly) and the quarterly newsletter for free by registering at http://www.gmo.com

Thursday, July 26, 2012

Marc Faber - Coming Next: Global Crash and U.S. Treasury Bubble Popping

Marc Faber is interviewed on Capital Account (Russia Today) by Lauren Lyster, where the talks about his views on US treasuries and capital markets, the Chinese economy and the consequences of a Chinese slowdown.


First, he explains that since 1981 were the yield was above 15%, US treasury have been in a bull market and is in bubble territory. But as with the Nasdaq in 1999, a bubble can continue inflation, and some friends of Marc Faber think 10 years trasuries will eventually yield less than 1%, and 30 years less than 2%. But his own view is that if yields increase again in markets such as the US and Japan, money will flow into equities, so he's not really worried if stock markets go down, even though he does not rule out a crash.

When asked about China, he basically says that Chinese government numbers are bogus, and when you look at Taiwan and South Korea, you'll find their exports to China are flat, and electricity consumption in China also show a weak picture of the Chinese economy.

Finally, he gives his outlook on what is happening now, and explains there is clearly a recession in Europe, the US is slowing down, but a China slowdown would be more important to the global economy, because it would have a strong impact on emerging economies. Currently Asia is certainly not in recession, but there is basically no growth.

Marc Faber appears in the first 10 minutes below, and the second part is about Libor with a zero hedge contributor.

Tuesday, May 15, 2012

GMO 7-Year Asset Class Forecasts - April 2012

GMO has just released its monthly 7-year Asset Class Forecasts and the expected annualized returns  have not changed much since last month:
  • US Large caps: -0.2% per year
  • US Small caps: -1.7% per year
  • US High Quality: 3.9% per year
  • International Large caps: 4.6% per year
  • International Small caps: 3.4% per year
  • Emerging Markets: 5.2% per year
US stocks should still be avoided as investments, and bonds anywhere in the world will be a disaster. If the stock markets continue their slump this month, the expected 7-year return should go up in GMO May forecast.

The ways to invested based on these expected returns with ETF are the same as last month.

You can receive GMO's monthly forecasts and the quarterly newsletter by registering at http://www.gmo.com (that's free).

Wednesday, May 2, 2012

Jim Rogers: The Next Recession (2013,2014) Will Be Much Worse

Jim rogers is interviewed on Business Insider by Henry Blodget on May 2, 2012.

He explains that because of the increase in debt, the next economic downturn will be much worse. We had a recession in 2002, then 2008 and the next one cannot be far away and should probably  occur in 2013 or 2014.

There is a lot of good news currently because we are in an election year and the government and the federal reserve are spending a lot of money, and the government statistics are massaged to make the economy look better than it really is. But in reality, the situation is getting worse, because the debt is getting much much worse.

Most people agree that the US is in relative decline against the rest of the world, but Jim Rogers also thinks the US in absolute decline as it is the larger debtor nation in history, and the country is over extended militarily over the world.

He concludes on a positive note by saying he's very bullish on agriculture in the US, and farm land is nowhere near a bubble yet.

Monday, April 30, 2012

Marc Faber on Money Printing, Asset Allocation, Crude Oil and More

Here's a 2 part interview of Marc Faber by Future Money Trends uploaded on the 29th of April 2012.

In the first video, MArc Faber explains that money printing won't help the general population, but it will increase asset prices, so people who own assets will benefit. The other issue is that central banks can't control where the money go and as a consequence the unemployment rate has not improved much ion the US and in Europe, but people living in emerging economies have benefited.

When asked about equities, he said that also equities are not a good bargain right now, and we may have the high for the end on the S&P 500 at 1422, there is a big risk in not owning equities because of (you guessed it) money printing. He recommends to own some equities especially in Asia (dividends are good ~ 5 to 7%) possibly via ETFs, some precious metals, and for US residents, some real estate in the South of the US.

He concludes by explaining that eventually there will be a complete reset, a complete collapse because there is simply too much debt with bankrupt banks lending to bankrupt to governments and vice versa, and the Ponzi scheme will come to an end. In the second video, they discuss how the ponzi scheme could end. Marc thinks there could be significant price inflation, government may try to give more handouts to their citizen while increasing taxes on rich people, and eventually they'll go to war to put the blame on some other countries.

Then  they switch to discussing about crude oil. Marc Faber first explains that oil prices are volatile and much of it is due to government policy such as manipulating interest rates. When he looks at several aspect of the oil market (demand in the west flat, demand rising in emerging markets, supply constraint and geopolitical tensions in the middle east), he would rather be long on oil.

Marc then talks about  the declining standard of living of US citizen which has started some 30 to 40 years ago compared to the rest of the world and it will continue to fall.

Finally, he's asked what he would advice to young people in Western economies. It might not always be a good idea to borrow money to get a degree, but if your parents are rich enough to pay it, then go for it. He would then start to work for somebody successful in any industry and acquire knowledge. Obviously, you should choose something that you like. There are different kind of success, not only monetary, but a happy family, helping others may also be successes.

Thursday, April 12, 2012

Investing in Natual Gas Revisited - FCG ETF

I've been keen on investing in natural gas for well over a year, and the timing hasn't been right until now. But with natural gas spot price dropping below 2 dollars per million British thermal units (MBTU) yesterday, and hitting a 14-year low, I thought I might deal with this investment idea again.

First let's make the case for investing in US natural gas.


The best time to buy commodities is when they are depressed. Let's have a look at US natural gas for the last 15 years (Source: IndexMundi.com)

The price is now back to 1997/1999 levels, right before the start of the massive commodities bull market and massive monetary inflation by central banks do not appear to be affecting natgas price.

If you think a 15-year low might be a good investment opportunity, what about an inflation adjusted 36-year low?
Source:Our Finite World
This chart was updated in January 2012, when natural gas was still above 2 USD per MTBU and it has since dropped to 1.98 USD per MBTU, so we are at least at a 36-year low (or very close to it) when adjusted with official inflation numbers.


Pundits explains the price is low because of the glut of natural gas attributed to new technologies such as fracking, and this is certainly a very good point. But there is another aspect which is very bullish for US natural gas: international gas market. Russian natural gas and Indonesian LNG are still in a upward trend, and currently Russian natural gas is over 6 times more expensive than US natural gas as shown in the 15-year charts below (Source: IndexMundi.com).

Russian Natural Gas (1997-2012)

Indonesian LNG (1997-2012)
Natural gas is not has easy to transport as crude oil for example, but one of the issue is the lack of LNG terminal with the ability to export liquefied gas to international markets which would increase the price of natural gas in the US and help decrease the cost of natural gas overseas. According to Wikipedia, there is only one liquefaction terminal (for export) in Alaska for the whole US, but there are 13 regasification terminals (for import). There are 2 proposed liquefaction terminals in Louisiana and Oregon. Once completed, the US will be able to export more natural gas and hopefully take advantage of the differential between local and international prices.

Finally, Crude Oil (WTI) to Natural Gas price Ratio stands now at over 50, whereas the historical norm has been around 8 to 10. See chart below (Souce: stockcharts.com)

So that means for a given amount of energy natural gas is about 5 times cheaper than crude oil. In reality, this is obviously not that easy as those 2 fuels are not interchangeable, but companies may start to invest more in power plant and transportation that can accommodate natural gas.

Now we have made the case to invest in natural gas, let's see how it can be done


There are some ETF to invest in Natural Gas such as UNG (USA) that are supposed to track natural gas price. However, their cost (due to diverse costs and contango) is prohibitive so that I would really advise against investing in those, unless you are able to correctly guess the price of Natgas within 3 months. Those types of ETF will go to zero by design.

You could potentially invest in companies such as Chesapeake or SandRidge Energy (SD), but if natural gas stays too low for too long some of those companies may go bankrupt and you'd lose all your investment. If you have enough capital, you could buy a list a companies involved in natural gas extraction and exploration, but for most of us, the simplest is to invest in mutual funds or ETF.

First Trust ISE-Revere Natural Gas Idx (FCG) is an ETF tracking ISE-REVERE Natural Gas Index which is composed of the stock of companies dealing with natural gas production and exploration.

Let's see how FCG fared in the last five years (Source: Yahoo Finance).
The first obvious thing is that it tracks natural gas rather poorly. FCG followed the price hike in 2008, but since 2009 it has more or less tracked the performance of the S&P 500. This makes me a little uneasy to buy FCG right now, but in case of further weakness (at least  below 15), it might be interesting to start buying this ETF to have some (limited) exposure to natural gas.

I'm not fully satisfied with this method of investing in natural gas, but it's the best I've found so far. If you have better ideas, let me know.

I've also seen some companies are selling Oil and Gas Royalty Rights, but I have not checked this into details yet, as it may not be easy to access such investment for oversea investors.

Saturday, January 28, 2012

US Markets Valuation, Sentiment and Technical Analysis - January 2012

In recent weeks, the S&P 500 has performed very well, almost reaching 2011 highs. At the same time, several indicators would seem to indicate a recession is coming to the US in 2012 and the Baltic dry Index does not look good either.

Today, I'm going to look at US markets, both in terms of valuation and sentiment. I will also look into technical factors to help determine whether it is a good time to sell or even short US markets.

S&P 500 Valuation.

For long term investors, Shiller S&P 500 CAPE (10-year price earning ratio adjusted for inflation) is the reference to assess whether the S&P 500 is undervalued or overvalued. Here's what it looks like today:

 The CAPE stands at 21.14, it's much lower than the CAPE in 2000 (That is when Shiller talked about "irrational exuberance"), but still high compared to historical CAPE (average is around 15-16).

Another way, I like to look at valuation is by looking at earnings only. Historically, they've had a tendency to increase at a fix rate over long period of time and always oscillate around the trend line. That's the "mean reversion" preached by Jeremy Grantham. Here's the logarithmic chart of S&P 500 inflation-adjusted earnings between 1870 and 2012.

In 2011, earnings are above average and will revert to the mean at some point. Of course this could be this year or in several years.

Based on the 2 metrics above, it seems that based on valuation it is rather risky to invest in the S&P 500 or at least it's likely to average disappointing returns.

US Market Investors Sentiment.

Previously I liked to follow Market Harmonics Bull/Bear ratio, but it is not a free service anymore since last April. Now, I use the AAII sentiment index instead:
 Week ending 1/25/2012

Bullish 48.4%
up 1.2
Neutral 32.7%
up 3.5
Bearish 18.9%
down 4.7


According the AAII, the long term average are as follows: Bullish: 39%,  Neutral: 31% and  Bearish: 30%.
That shows people are now pretty optimist about the future. As a contrarian, that would be a bearish sign.

However, I like to look at things in a longer term perspective using AAII-14, as explained in my post "Using AAII Sentiment Survey to Time the Market". If the 14-week moving average of the AAII "Bullish" sentiment index is at 30% or below is a long term buy, above 50% it is a long term sell.
Now the AAII-14 is at about 42%, so this is neutral.

S&P 500 Technicals.

I'm now going to look at my 2 favorites technical metrics the RSI-14 and the index showing the percentage of stocks above their 200-day moving average (NYA200R).


I use the 14-day relative strength index moving average for short term moves.


The S&P 500 6-month chart and RSI-14 chart (Source: Yahoo Finance) shows it is now at 76.20. On the 23rd of January the RSI-14 was at 87.57 which was overbought, so a short term correction should be expected.

The NYA200R is really the index which tell me "wait" when other indicators tell me to buy or sell. Here's what it looks like today. (Source: StockCharts.com)

At 65.10%, the NYA200R tells me there is probably more upside potential for the S&P 500. I would become wary of holding stocks if it reached 80% or more for several weeks/month.

Conclusion

As some indicators suggest, there are significant recession risks for 2012. The S&P 500 seems relatively overvalued compared to historical ratios. Short term investors are very bullish and the market is overbought. However, longer term, it appears we have to not reached extreme bullishness (as the AAII-14 implies) and the NYA200R would suggest stocks have still more upside.

Based on this analysis, I would personally not add any position at the moment because of valuation and short-term bullishness and would even consider decreasing exposure to US stocks. I would not short the market however, because not all indicators are extreme and we have mad men (e.g. Ben Bernanke) and women (e.g. Janet Yellen) at the head of the US federal reserve that could unleash QE3 after announcing zero interest rates until 2014 since week.

Friday, January 20, 2012

Marc Faber: Relax! Stocks Won't Collpase

Marc Faber is interviewed by CNN on the 20th of January 2012.

First, they discuss he views that US bonds should be rated Junk, with the debt increasing from 1 trillion dollars in 1990 to 5 trillion dollars in 2000 to now over 15 trillion dollars and if we include unfunded liabilities the number would be much higher (something like 100 trillion dollars).

Now, the debt can be serviced because of low interest rates, but if those would be to increase, it would become much more problematic.

Marc Faber also explained that everybody should relax, equities won't collpase because there isa stron (technical) support at 1100 on the S&P 500, and if the S&P 500 drops 200 points, the federal reserve will start QE3.

Finally, he said that Asian banks (in Thailand and Singapore) are a much safer place than western banks for deposit and that contrary to popular beliefs, emerging economies do no rely so much on the west to sustain themselves.

Tuesday, January 17, 2012

2012 Recession Likely

A recession in the US is likely according to indicators used by John Hussman of Hussmann Funds and the WLI (Weekly Leading Indicator) growth by the ECRI.

John Hussman created a chart (below) corresponding to the average of standardized values (mean zero, unit variance) of the following variables:
  • 6 month change in S&P 500
  • 6 month change in nonfarm payrolls
  • 12 month change in nonfarm payrolls
  • 6 month change in average weekly hours worked
  • ISM Purchasing Managers Index
  • ISM New Orders Index
  • OECD Leading Indicator - total world, 
  • OECD Leading Indicator - US, 
  • ECRI Weekly Leading Index growth
  • Chicago Fed National Activity Index 
  • 3 month average, credit spreads (Baa vs 10-year Treasury), 
  • Industrial commodity prices - 12 month and 6 month change
  • New building permits 6 month change.
Here's the chart between 1952 and 2011.


The level we currently get (-0.5) has always been associated with recessions, except with the false positive in 2003, right after the 2001/2002 recession. It correctly predicted or coincided with 10 recessions, never missed one and gave one incorrect signal as previously mentioned.
The WLIG currently stands at -8.4 (6 Jan 2012), a level usually associated with recession. ECRI insists however they use other leading indicator to make a recession call. That's why they did not make a recession call in 2010, but did make one for 2012.

There is now a fair amount of optimism in AAII survey (~50% bullish), although its' not extreme yet, and lagging indicators give a positive outlook for the US economy, so those recession calls still have many critics, but I believe they will eventually be proven right this year.

Tuesday, December 6, 2011

Jeremy Grantham Quarterly Newsletter December 2011 Summary

Jeremy Granthan from GMO has just released its Quarterly Newsletters entitled "The Shortest Quarterly Letter Ever".

Yes, it's short, it's just 4 pages long and comprise a list of notes to himself, subject that he plans to write about mainly:
  • Caution is advised due to the situation in Europe.
  • The U.S., and to some extent the world, will not easily recover from the current level of debt overhang.
  • Western world will know a period of slow growth due to population dynamics and lack of savings especially in the US and the UK.
  • US income gap inequality.
  • Equity markets have been absolutely bombarded by bad news since last spring.
  • Profit margins are likely to decrease.
  • “No Market for Young Men.”: A market forecast of the market (S&P 500) based on previous bear market and showing it return below 1000 and staying there for about 10 more years.
  • Underweight equities until the market becomes cheap again or during the next 3rd year of the presidential cycle (2015) whichever comes first.

Finally he gives some recommendations:

  • Avoid lower quality U.S. stocks but otherwise have a near normal weight in global equities.
  • Tilt, where possible, to safety.
  • Try to avoid duration risk in bonds. For the long term they are desperately unattractive.
  • I like (personally) resources in the ground on a 10-year horizon, but I am nibbling in very slowly because, as per my Quarterly Letter on resources in April 2011, I fear a major short-term decline in commodities based on a combination of less bad weather – which has been bad, but indeed less bad – and economic weakness, especially in China. Prices have declined, often quite substantially, since that letter. However, I believe chances for further price declines in resources are still better than 50/50 as China and the world slow down for a while, and the weather becomes a bit more stable.
You can read the complete 4-page newsletter available for free on GMO website.

Tuesday, November 15, 2011

GMO 7 Year Asset Forecast Says Stay Away From Bonds

GMO has just released its monthly 7-year Asset Class Forecasts (November 2011).
Here are the expected annualized return (based on valuation and historical earning growth):

US Large caps: 1.8% per year
US Small caps: -0.4% per year
US High Quality: 5.4% per year
International Large caps: 5.8% per year
International Small caps: 4.6% per year
Emerging Markets: 5.6% per year

Different kinds of bonds are expected to return between -2.3% and 1.3% per year so that is all bonds are expected to return negative interests except emerging market bonds. Managed Timber is expected to return 6% per year.
Those are real returns adjusted for inflation of 2.5% per year.

You can receive GMO's forecasts (monthly) and the quarterly newsletter for free by registering at http://www.gmo.com

Tuesday, October 11, 2011

Marc Faber: Lack of Savings is the Problem of the US

Marc Faber was interviewed on CNBC on the 11th of October 2011.

He said he was bullish on the US dollar:
Despite the fact that the (European Central Bank) and the European government will flood the market with liquidity to bail themselves out, global liquidity is tightening," Faber said. "Whenever global liquidity is tightening it is bad for asset prices but good for the U.S. dollar, as was the case in 2008.
He also discussed the debt issues in the USA, Europe and Japan and explained there is no way to repay that debt without a major collapse:

We've had far too many interventions in the Western world where the share of total economy that goes to government and is government-sponsored has grown. That essentially makes it very difficult for the Western world to grow sustainably...I don't see how the Western world including the U.S., Japan and Western Europe can grow. They're going to stagnate.
Finally, he ranted against regulations in the US:
We have expansionary fiscal policies, we have expansionary monetary policies but we have restrictive regulatory policies and it curtails any initiative by the small businessman and the large businessman. He doesn't employ and invest capital in the U.S. He does that in China or somewhere else in the world where the regulatory environment is more favorable.

Monday, October 10, 2011

GMO 7 Year Asset Class Forecast (Q3 2011)

GMO has just released its monthly 7-year Asset Class Forecasts and here are the expected annualized return (based on valuation and historical earning growth):
  • US Large caps: 3.1% per year
  • US Small caps: 1.5% per year
  • US High Quality: 6.6% per year
  • International Large caps: 7.2% per year
  • International Small caps: 6.0% per year
  • Emerging Markets: 7.2% per year
Different kinds of bonds are expected to return between -2.7% and 1.9% per year.
Managed Timber is expected to return 6% per year.
Those are real returns adjusted for inflation of 2.5% per year.

So the best performing assets should be international large caps (Europe & Japan?) and emerging markets and the worst performing assets should be US and international bonds.

One way to act on this forecast via ETF would be to buy iShares MSCI Japan Index Fund(EWJ), iShares S&P Europe 350 Index Fund (IEV) and iShares MSCI BRIC Index (BKF) on the long side, and buy short ETF for bonds such as ProShares Short 20+ Year Treasuries (TBF). If you can short, you could do so with SPDR Barclays Capital International Treasury Bonds (BWX).

You can receive GMO's forecasts (monthly) and the quarterly newsletter for free by registering at http://www.gmo.com

Tuesday, October 4, 2011

Jim Rogers: Tarrifs would be a Disaster

Jim Rogers interview on Russia Today America on the 3rd of October 2011.

They discussed about the currency law debated in congress mainly related to the Chinese RMB currency manipulation. Jim Rogers aid if the US implemented tariffs, everybody would suffer, the dollar could plunge and interest rates go up.

He then explained that he owned the US dollar because everybody was negative about the the dollar and that many people perceived the US dollar as a safe haven.

Finally, they talked about the economic outlook for the US and the world.

Thursday, February 3, 2011

Marc Faber on CNBC: Bernanke is a liar!

At the Russia Forum in Moscow, Marc Faber talks with CNBC about the "economic recovery", Egypt, emerging markets and inflation.


Faber believes the global economy may be fine for the first half of the year:
"We have to realize that it’s an artificial recovery driven by ultra-expansionary monetary policies and also ultra-expansionary fiscal policies"

Faber also predicts that deficits will lead to renewed problems down the road.

"The annual cost of living increases are more than 5% today and the Bureau of Labor Statistics is continuously lying about the inflation rate, including Mr. Bernanke. He’s a liar. Inflation is much higher than what they publish"

Faber says the true cost of living increase for most US households is 5-8%, and just below that in Western Europe.