Showing posts with label price earning ratio. Show all posts

Sunday, July 19, 2020

Long Term Charts - Thai Stock Market (Thai SET) Update - July 2020

It's been a long time since I've not provided an update to long term charts of the Thai stock market. More exactly over 5 years, because to be honest nothing much happened during those years, but we've got a bit more action this year, so it might be a good time to have another look.

Long Term Chart Thai SET 1976 - 2020

The Thai stock market peaked at around 1,830 in February 2018, and it dropped to under 1,200 in March following the politician answers and lockdowns due to COVID-19. It's back to around 1,350 since them It was a sharp, but let's check more long term charts to find out more about valuations.
Thai SET PER - 1976 - 2020

One metric is the price earning ratio, and never really went under 10 that historically is a buying opportunity. Getting to 5 or under would be a lifetime buying opportunity, but obviously it does not happen often. We should also expect earnings to drop significantly, and I'm not convinced they'll recoever that quickly so the PER should soon go higher, unless the average price of stocks in the Thai SET goes down as well.


Thai SET Price-to-Book Value - 1988 - 2020

The price to book value ratio is fairly affordable, so that's one metric where the Thai SET looks fair valued or even slightly inexpensive.

Thai SET Dividend Yield - 1988 to 2020

From the chart above, a dividend yield of just under 4% look attractive considering current interest rate on fixed deposits are under 1%. Buying large stocks for dividends might be a good way to be paid to wait with limited downside. That would remain true as long as dividends are not cut, and that's not guaranteed considering the environment we live in.

But no buying on my side for now, so I'll be patient, and since I expect the market to move again this year, I'll likely post an update in December.

Sunday, June 28, 2020

S&P 500 Analysis: Valuation, Sentiment and Technicals - June 2020

It's been a very long time since I have done an S&P 500 analysis with valuation, sentiment and technical indicators taken into account. So let's get an updated picture for June 2020.

S&P 500 Valuation


One way to look at value is to check out the CAPE 10 ratio (Cyclically Adjusted
Price Earnings Ratio over a 10-year period). It now stands at close to 30, and that's before "COVID-19" earnings are released.


That's historically very elevated and similar to the 1929 stock market bubble. Expect the number to shoot with earning announcements if the stock market does not correct first.

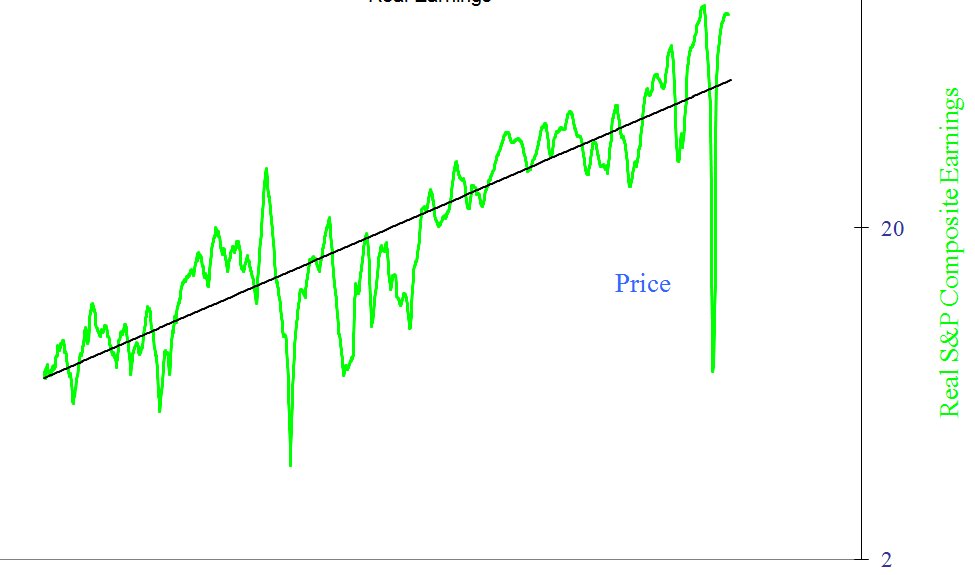
Corporate earnings tend to revert to the mean over time.


It's a lagging indicator, as Q2 earnings have not been announced just yet. But the chart shows earnings were way above the historical trend before the crisis. July will be interested as earnings announcement will mean this number possibly goes negative.

AAII Sentiment

The stock market is all about people's feelings, and AAII members are not buying the rally, as they have still 48.9% bearish.
AAII Sentiment Survey June 2020
We can see the 8-week moving average bullishness chart is still very low.
AAII Sentiment Survey Chart June 2020

The AAII sentiment survey used to be a contrarian indicator, but I'm not sure it's still the case. This would mean stocks have further gains, but in this case I suppose AAII investor believe the market will go down in the next six months, and did not really participate in the rally..

Technical Indicators


The RSI-14 (14-day relative strength index) can help us find out if a market is oversold or overbought.
RSI-14 S&P 500 June 2020

The RSI-14 is now at 54 or close to neutral. This compares to close to 80 in January/February when markets were clearly overbought in the short term.

The NYA200R (percentage of stocks over their 200-day moving average) can be used to determine if only a few stocks participated in a rally.

NYA200R  Weekly Chart June 2020


The current chart shows only about 25% of stocks are above their 200-day moving average meaning the elevated S&P 500 stock market level may be due to some  larger capitalization, while smaller stocks are still suffering, or not participating in the rally just as much.

Conclusion

Apart from the US stock market valuation metrics to which we could add the stock market to GDP ratio, we are not really at extremes while looking at sentiment and technical indicators. So I would be very wary of going long, but at the same time the rally may not be over. Another important metrics for investors in 2020 will also be the Federal Reserve assets purchases, but it's pretty hard to forecast what a small group of people will do, especially during a presidential election year.

Saturday, March 7, 2020

Undervalued Markets in March 2020 - Top 10 Countries

Value and contrarian investors will always look for undervalued and unloved markets or stocks, and one tool I like to use to find out which market may be worth looking into is Starcapital stock market valuation that ranks different countries based on their CAPE (Cost Adjusted Price Earning Ratio), average dividend yield, price-to-book ratio, and price-to-sales-ratio. They also show RS26 (26-weeks relative strength) and RS52 ratio to show which markets were oversold or overbought in respectively the last 6 months and the last year.

This is what the map looks like on February 28, 2020 with countries in blue being undervalued, and the ones in red being overvalued using CAPE as reference.


Russia, Turkey, Poland, Oman looks to be quite undervalued using this metric, while the US, Ireland, Switzerland, New Zeland, and Finland are overvalued.

Here's the top ten list of the most undervalued markets as of March 2020.


That's Russia, China, Italy, Spain, Singapore, Turkey, Austria, South Korea, Portugal, and Hungary.

Starcapital does not use the CAPE as the only metric to rank to the country with average PC (Price-to-cashflow), PB (Price-to-book), and PS (Price-to-sales) ratios. To find out if the CAPE is undervalued, one needs to look at the long term ratio for each country, and the ratio can not be compared between countries because each stock market has different types of companies. For example, Russia will have a large share of companies related to the oil business which command a lower price-earning ratio. Sadly, the company does not provide its historical data, so I'll just trust its color scheme for that part.

If the price-to-book ratio is lower than one, that means the stock price is cheaper than the book value, and it's always a good metric to check you don't overpay for a stock or market. If the dividend yield is fairly high, that's often a sign, stocks are undervalued as well.

I view the relative strength index more as a timing tool, as it shows whether the stocks for a given country were sold or bought during the time period. Starcapital allows to filter results as well, and I often set PB to one or lower, and RS26 to a value under one (e.g. 0.94).


That leaves us with 5 countries: Russia, Singapore, Austria, South Korea, and Poland. The next step is to look at mid-term charts (e.g. 10 years) to see how stocks performed. I like to use trading economics.


The Russian stock market did very well in the last 6 years, and we did buy a Russian ETF (3027.HK) in 2014-2015, and sold in October/November 2019. It went up further since then, but a correction happened due to the Coronavirus panic. If the market corrects further it could be a nice entry point.


The Singapore stock market (STI) has been trading in the 2600-3500 range in the last ten years, so if it goes back to 2700 points it may be an interesting entry point. Looking at an even longer-term chart, we can see the market performed fairly well since 2002, but as a smaller country, it may suffer more in downturns.

Next up is the Austria stock market (ATX), which we can see went down for over 2 years.
Looking at the chart since 2001, we can see the ATX never covered in a big way from the GFC (Global Financial Crisis) in 2008.
It's almost 50% below its all-time high in 2017..., and if we look at the long term bottom trend we could go a line showing there may be opportunities right now. I still feel uneasy investing in Europe due to structural issues with the Euros though.


The 10-year chart of the KOSPI (South Korean stock market) shows the index did not return much over the last ten years, and long term bull markets are often born from a long bottoming process.

To balance that, the KOSPI did really well in the first decade of this century, quadrupling from 500 points to over 200 points in 2007, but 13 years later we are still at the same point. It's been a long wait for investors who are still getting a 2.3% dividend yield at this time.

Let's finish with the Polish stock market (WIG). The last two years have been brutal which should explain why it's now considered an undervalued stock market.
It seems to be at the bottom of the trends (using a line passing through 2012 and 2016 bottoms), but the 20-year chart shows again the great performance of emerging markets in the 2000's.
Yet the WIG is still well below its all-time high in 2017. All those five markets look interesting, in the short term are likely to be affected by the impact of the Coronavirus outbreak, the policy decisions of central banks and government around the world, and potentially the health of the US stock market which looks to be extended at this time, but we'll look into the later in a subsequent post

Sunday, July 21, 2013

Long Term Charts of the Thai Stock Market (SET) - July 2013 Update

This article is the bi-annual update of the long term charts of the SET Index, price earning ratio and price to book value posted on CNX Translation Forums.

Time for another bi-annual update of the long term charts of the SET (Stock Exchange of Thailand).

As usual, the first chart is the SET index between 1975 and now. This index now stands at about 1480, so a little higher than six month ago (1440), but this still results from a correction after the index reached 1600, which led it to fall as low as 1362, so sentiment may have changed.

Image

The PER stands at 16.5, a level still high but better than the 18 we got 6 months ago, and since the SET is about at the small level, this is the result of better earnings. Such PER is still fairly high for the Thai stock market, so there may not be much value at this level.
Image

The price to book value is about the same at 2.3 (vs 2.4) which, again, does not make the Thai stock market a bargain.
Image

To conclude, I still consider the Thai stock market to be somewhat overvalued at an historical level, as well as compared to some other stocks markets around the world such as Europe, Russian, or Vietnam. The dividend yield is still around 3% which is about the same as what you get for a 15 Months fixed deposit. Interestingly, the 15-month deposit is 3%, 24- and 36-month deposit 2.625%, and 10-month 2.75%, which could imply banks may expect some economic troubles within 2 to 3 years.

Monday, February 4, 2013

S&P 500 Analysis: Valuation, Sentiment and Technicals - February 2013 Update

Last time I did this analysis was in January 2012, and I found out the US market was not particularly attractive with the S&P 500 just over 1,300, but not extended quite enough (AAII sentiment) to short it, the S&P 500 is now over 1,500, so let's update this long term analysis.

S&P 500 Valuation

The Shiller S&P 500 CAPE (10-year price earning ratio adjusted for inflation) is the reference to assess whether the S&P 500 is undervalued or overvalued over long periods of time. Here's what it looks like now:


The CAPE stands at 22.77 vs 21.14 over a year ago, so by this metric the S&P 500 is even more overvalued than last year. Although it's still much lower than the CAPE in 2000, it's still high compared to historical CAPE, and at the level of previous tops in the stock market (1901, 1929 and 1966).

Many analysts like to look at the short term, and show that forward PE ratio is only about 14, and use this number to explain stocks are a pretty good bargain right now. In 2007, we had the same rhetoric, as forward PE was low because of high corporate earnings, which were widely above their long term trend.
The chart above shows the S&P 500 earning adjust for inflation (real earning) between 1870 and today. We are clearly above trend, and this does not bode well for future returns.

Based on the 2 metrics above, the conclusion is the same as last year and it appears that based on valuation investing in the S&P 500 for the next several years might not be the best of ideas, or least it's rather risky.


US Market Investors Sentiment

Based on last week AAII sentiment survey, investors are moderately bullish for the next 6 months.
But I like to look at the 14-week moving average of the AAII sentiment survey (which I call AAII-14), since I found it to be useful to identify  some of the optimistic (and market) peaks of the past. The rule goes as follows: If the 14-week moving average of the AAII "Bullish" sentiment index is at 30% or below there could be a long term buying opportunity, above 50% there could be a long term sell opportunity.


Now this is getting interesting, as sentiment is pretty bullish, and AAII-14 getting closer to the 50% mark, even though it's not quite there for now.

S&P 500 Technicals

We are now going to have a look at some technical indicators namely RSI-14 and NYA200R, as well as draw trend lines on the S&P 500 to see what it might do in the short term.


The chart above (Yahoo Finance) is the 6 month chart of the S&P 500 with RSI-14, and we've been around 80 for a little while, which means the market is overbought in the short term.

NYA200R shows over 83% of stock are above their 200-day moving average, which is  not very bullish for stocks either
Now let's get back the S&P 500 chart, but this time over 5 years, and let's try to draw bottom and top parallel trend lines.


We seem to have reached the top of the trend started since 2010, so a correction (at least in the short term) could occur very soon.

Conclusion

In the short term, all indicators shown above are bearish since they all indicate the market is overbought, so it's prudent to own less US stock at the moment, and traders may also consider shorting for the next few weeks/months.

In the long term, the S&P 500 is overvalued by all measures, but market participant is not extreme just yet, so there could be a short term correction, followed by a rally before stocks head south for a longer period of times. Alternatively, it's also possible positive sentiment carries on the S&P 500 to new highs, and the long term reversal comes earlier than expected.

Monday, January 21, 2013

Long Term Charts Thai Stock Market - January 2013 Update

This is a repost of the article found on CNX Translation forums.

6 months have gone since our last update, and its time again to update the long term charts of the Thai stock market.

The first chart is the SET index between 1975 and January 2013. Following other indices around the world, and despite my overvaluation view 6 months ago, the Thai stock market has continued its (unstoppable) rise in the last 6 months, and now stands at about 1440, a rise of about 40% since I started to become cautious.

Image

The PER is now around 18, mainly due to the stock market improvement. At 15, I started to be bearish, so at 18 it's extremely unusual for the Thai stock market. So either earnings have to go up substantially, either the stock market has to plunge, or a combination of the two.
Image

The price to book value slowly crept up to 2.4 which also starts to make Thai stocks overvalued, especially compared to what you get in other markets around the world. (European stocks have a P/B ratio around 1 now)
Image

To conclude, I believe the Thai stock market is relatively overvalued both historically, and compared to other stocks markets around the world. The dividend yield is now around 3% which is is that more than can get in a fixed deposit (Bangkok Bank now offers up to 2.65 % p.a for a 36 months fixed deposit), so why take the risk? There is also a lot of optimism around the world, which IMHO is not warranted, so I would not be surprised to see a massive correction in the Thai stock market within the next year.

Saturday, July 21, 2012

Long Term Charts of the Thai Stock Market (SET) - July 2012 Update

This article is the bi-annual update of the long term charts of the SET Index, price earning ratio and price to book value posted on CNX Translation Forum.

Here we go again with our bi-annual update for the long term charts of the Thai stock market.

The chart below is the SET index between 1975 and July 2012. To my surprise, the Thai stock market has gone up sharply in the last 6 months, despite the European crisis and the slowdown in China and globally.
Image

The PER has gone back up to around 15, mainly due to the stock market improvement, but also because of lower earnings. This metric make me bearish again, because when the Thai stock market has a PER above 15, it is usually not a good time to invest.
Image

The price to book value went up to 2 which does not make Thai stocks really overvalued, but not cheap either. For reference, in Europe, the P/B ratio is around 1 now.
Image

To conclude, I believe the Thai stock market is relatively overvalued both historically, and compared to other stocks markets around the world. The dividend yield is now 3.63% which is slightly higher than what you can get in a fixed deposit (Bangkok Bank now offers up to 3.25 % p.a for a 36 months fixed deposit). I also believe a recession has already hit western economies which may worsen later this year or in 2013, and we'll see a hard-landing in China, both of these events should affect the Thai stock, and I would not be surprised if we could see a 30% correction in the Thai stock market within the next 2 years.

Saturday, January 28, 2012

US Markets Valuation, Sentiment and Technical Analysis - January 2012

In recent weeks, the S&P 500 has performed very well, almost reaching 2011 highs. At the same time, several indicators would seem to indicate a recession is coming to the US in 2012 and the Baltic dry Index does not look good either.

Today, I'm going to look at US markets, both in terms of valuation and sentiment. I will also look into technical factors to help determine whether it is a good time to sell or even short US markets.

S&P 500 Valuation.

For long term investors, Shiller S&P 500 CAPE (10-year price earning ratio adjusted for inflation) is the reference to assess whether the S&P 500 is undervalued or overvalued. Here's what it looks like today:

 The CAPE stands at 21.14, it's much lower than the CAPE in 2000 (That is when Shiller talked about "irrational exuberance"), but still high compared to historical CAPE (average is around 15-16).

Another way, I like to look at valuation is by looking at earnings only. Historically, they've had a tendency to increase at a fix rate over long period of time and always oscillate around the trend line. That's the "mean reversion" preached by Jeremy Grantham. Here's the logarithmic chart of S&P 500 inflation-adjusted earnings between 1870 and 2012.

In 2011, earnings are above average and will revert to the mean at some point. Of course this could be this year or in several years.

Based on the 2 metrics above, it seems that based on valuation it is rather risky to invest in the S&P 500 or at least it's likely to average disappointing returns.

US Market Investors Sentiment.

Previously I liked to follow Market Harmonics Bull/Bear ratio, but it is not a free service anymore since last April. Now, I use the AAII sentiment index instead:
 Week ending 1/25/2012

Bullish 48.4%
up 1.2
Neutral 32.7%
up 3.5
Bearish 18.9%
down 4.7


According the AAII, the long term average are as follows: Bullish: 39%,  Neutral: 31% and  Bearish: 30%.
That shows people are now pretty optimist about the future. As a contrarian, that would be a bearish sign.

However, I like to look at things in a longer term perspective using AAII-14, as explained in my post "Using AAII Sentiment Survey to Time the Market". If the 14-week moving average of the AAII "Bullish" sentiment index is at 30% or below is a long term buy, above 50% it is a long term sell.
Now the AAII-14 is at about 42%, so this is neutral.

S&P 500 Technicals.

I'm now going to look at my 2 favorites technical metrics the RSI-14 and the index showing the percentage of stocks above their 200-day moving average (NYA200R).


I use the 14-day relative strength index moving average for short term moves.


The S&P 500 6-month chart and RSI-14 chart (Source: Yahoo Finance) shows it is now at 76.20. On the 23rd of January the RSI-14 was at 87.57 which was overbought, so a short term correction should be expected.

The NYA200R is really the index which tell me "wait" when other indicators tell me to buy or sell. Here's what it looks like today. (Source: StockCharts.com)

At 65.10%, the NYA200R tells me there is probably more upside potential for the S&P 500. I would become wary of holding stocks if it reached 80% or more for several weeks/month.

Conclusion

As some indicators suggest, there are significant recession risks for 2012. The S&P 500 seems relatively overvalued compared to historical ratios. Short term investors are very bullish and the market is overbought. However, longer term, it appears we have to not reached extreme bullishness (as the AAII-14 implies) and the NYA200R would suggest stocks have still more upside.

Based on this analysis, I would personally not add any position at the moment because of valuation and short-term bullishness and would even consider decreasing exposure to US stocks. I would not short the market however, because not all indicators are extreme and we have mad men (e.g. Ben Bernanke) and women (e.g. Janet Yellen) at the head of the US federal reserve that could unleash QE3 after announcing zero interest rates until 2014 since week.

Saturday, January 21, 2012

Long Term Charts of the Thai Stock Market (SET) - January 2012 Update

This article is the bi-annual update of the long term charts of the SET Index, price earning ratio and price to book value posted on CNX Translation Forum.

Here's our bi-annual update for the long term charts of the Thai stock market.

The chart below is the SET index between 1975 and January 2012, it has fallen sharply after July before rebounding and now stands at 1058.66.

The PER went from 14.5 to 12 in the last six months, due to the correction and earnings improvements. This kind of PER is neutral if we compare it to the PE history of the Thai SET. Six months ago, I expected a correction due to the relatively high PE which occurred and now I'm neither bullish not bearish based on this metric.

The price to book value went down to 1.87 (vs 2.14 in July) which makes Thai stocks slightly more attractive compared to 6 months ago.

To conclude, I believe the Thai stock market is fairly valued at those levels and the average dividend yield is 3.72% (vs 2.92% 6 months ago) which is comparable to what you can get in a fixed deposit (Bangkok Bank now offers up to 3.5 % p.a for a 36 months fixed deposit). I would neither by buyer or seller. However, if your investments are concentrated in US and/or European economies, you may still consider buying Thai stocks as Emerging economies become less reliant on Western economies (although there is no complete decoupling just yet) and Thai banks have virtually no exposure to European debts which make them more resilient should a recession occur in western economies this year.

Tuesday, August 23, 2011

Will US Stocks stay in a Bear Market until 2014 ?

The answer could be yes according to a paper by FRBSF entitled "Boomer Retirement: Headwinds for U.S. Equity Markets?" where they compared price earning ratio in relation to demographics.

The first chart (above) compared the inflation adjusted P/E ratio of the S&P 500 to the M/O ratio. The M/O ratio is the ratio of the middle-age cohort, age 40–49, to the old-age cohort, age 60–69. As we can see the two seems correlated.

The second chart is where it becomes to be very interesting. Based on expected demographic trends (usually quite predictable), they created a model to see what the P/E ratio would look like in the years ahead. As we can see on the cahrt above, the P/E ratio is expected to bottom out around 2024 according to their model. That would mean another 13 years of bear market for the S&P 500.

This is also in accordance with Schiller's 10-year inflation adjusted P/E chart, where it shows bear market usually end with P/E below 10, except it does not provide timing.