Showing posts with label valuation. Show all posts

Sunday, March 15, 2020

Overvalued Markets (March 2020) - Top 10 Countries

Last week we wrote about the top 10 undervalued stock markets using data from StarCapital AG. Data is up-to-date as of February 28th, 2020, and markets went through interesting gyrations in the last two weeks, to say the least.

But let's go ahead anyway with a list of the top 10 overvalued markets based on metrics such as CAPE (Cost Adjusted Price Earning Ratio), average dividend yield, price-to-book ratio, and price-to-sales-ratio.

Here's the list of the top ten most undervalued markets as of March 2020.


Indonesia was the most expensive at the time, followed by the United States, India, New Zealand, Denmark, as well as Australia, Brazil, the Netherlands, Belgium, South Africa, and Switzerland. Most have experienced a sharp 20 to 30% drop in the last two weeks, Let's have a look at the 10-year charts of the largest markets, namely the United States, India, and Australia, using Trading Economics as the source.


The S&P 500 has a CAPE of around 28 before the drop. It went down as low as 2,400 points this week but ended the week at 2,711 points. Even with the drop of around 20%, the CAPE is still well over 20 historically speaking is considering to be overvalued for the US market. To get into undervalued territories, we'd have to go with a CAPE of under 10 which means the S&P 500 under 1,000 points at current levels. Note earnings are likely to sharply drop in the next quarters due to the reaction to the coronavirus outbreak.


 Another way to look at the long term valuation of the stock market is to check the valuation against the GDP. The Whilshire 5000 to GDP ratio (source: longtermtrends) is around 1.2 right now well above the historical average of ~0.8. If we ever went back to the ratio reached in 2009, the S&P 500 would be around 1,200 points.


Moving to India's stock market with the 10-year chart of the SENSEX shows the recent drop in perspective with the market still doubling since the lows in 2012. If we look at the 2008 lows when the SENSEX was at around 9,000 it nearly quadrupled in 12 years. If earnings grow at that pace that's not an issue, but the rise was also due to an expansion to the price-earning ratio which led to the overvaluation of the market.


The Australia S&P/ASX 200 stock market index does not look as extended as the other two. The CAPE was 18.7 at the end of February, and the sharp drop have brought it down just under 15. We don't have historical information about the Australian CAPE, but it's clearly not in undervaluation territories. Another measure to look at is the PB (Price-to-Book) ratio which was at 2.0, and undervalued markets are often around or even under 1. 

It normally takes one to two years for a bear market to bring valuations to fair value or undervalued, and Charles Nenner, a market cycles specialist, expects markets to bottom out at the end of 2021. Note that shorting stocks may be very risky due to the central bank involvement in markets (if they print enough, stocks will go higher no matter what), and purchasing bear ETFs often have very high associated costs.

Despite globalization, not all markets move in unison and some of the undervalued markets we pointed out last week start to have interesting valuation although it may pay to be patient. I'd see further weakness in Russia, Singapore, Austria, and South Korea as a potential buying opportunity once the situation with the Coronavirus become a little more clear.


Saturday, March 7, 2020

Undervalued Markets in March 2020 - Top 10 Countries

Value and contrarian investors will always look for undervalued and unloved markets or stocks, and one tool I like to use to find out which market may be worth looking into is Starcapital stock market valuation that ranks different countries based on their CAPE (Cost Adjusted Price Earning Ratio), average dividend yield, price-to-book ratio, and price-to-sales-ratio. They also show RS26 (26-weeks relative strength) and RS52 ratio to show which markets were oversold or overbought in respectively the last 6 months and the last year.

This is what the map looks like on February 28, 2020 with countries in blue being undervalued, and the ones in red being overvalued using CAPE as reference.


Russia, Turkey, Poland, Oman looks to be quite undervalued using this metric, while the US, Ireland, Switzerland, New Zeland, and Finland are overvalued.

Here's the top ten list of the most undervalued markets as of March 2020.


That's Russia, China, Italy, Spain, Singapore, Turkey, Austria, South Korea, Portugal, and Hungary.

Starcapital does not use the CAPE as the only metric to rank to the country with average PC (Price-to-cashflow), PB (Price-to-book), and PS (Price-to-sales) ratios. To find out if the CAPE is undervalued, one needs to look at the long term ratio for each country, and the ratio can not be compared between countries because each stock market has different types of companies. For example, Russia will have a large share of companies related to the oil business which command a lower price-earning ratio. Sadly, the company does not provide its historical data, so I'll just trust its color scheme for that part.

If the price-to-book ratio is lower than one, that means the stock price is cheaper than the book value, and it's always a good metric to check you don't overpay for a stock or market. If the dividend yield is fairly high, that's often a sign, stocks are undervalued as well.

I view the relative strength index more as a timing tool, as it shows whether the stocks for a given country were sold or bought during the time period. Starcapital allows to filter results as well, and I often set PB to one or lower, and RS26 to a value under one (e.g. 0.94).


That leaves us with 5 countries: Russia, Singapore, Austria, South Korea, and Poland. The next step is to look at mid-term charts (e.g. 10 years) to see how stocks performed. I like to use trading economics.


The Russian stock market did very well in the last 6 years, and we did buy a Russian ETF (3027.HK) in 2014-2015, and sold in October/November 2019. It went up further since then, but a correction happened due to the Coronavirus panic. If the market corrects further it could be a nice entry point.


The Singapore stock market (STI) has been trading in the 2600-3500 range in the last ten years, so if it goes back to 2700 points it may be an interesting entry point. Looking at an even longer-term chart, we can see the market performed fairly well since 2002, but as a smaller country, it may suffer more in downturns.

Next up is the Austria stock market (ATX), which we can see went down for over 2 years.
Looking at the chart since 2001, we can see the ATX never covered in a big way from the GFC (Global Financial Crisis) in 2008.
It's almost 50% below its all-time high in 2017..., and if we look at the long term bottom trend we could go a line showing there may be opportunities right now. I still feel uneasy investing in Europe due to structural issues with the Euros though.


The 10-year chart of the KOSPI (South Korean stock market) shows the index did not return much over the last ten years, and long term bull markets are often born from a long bottoming process.

To balance that, the KOSPI did really well in the first decade of this century, quadrupling from 500 points to over 200 points in 2007, but 13 years later we are still at the same point. It's been a long wait for investors who are still getting a 2.3% dividend yield at this time.

Let's finish with the Polish stock market (WIG). The last two years have been brutal which should explain why it's now considered an undervalued stock market.
It seems to be at the bottom of the trends (using a line passing through 2012 and 2016 bottoms), but the 20-year chart shows again the great performance of emerging markets in the 2000's.
Yet the WIG is still well below its all-time high in 2017. All those five markets look interesting, in the short term are likely to be affected by the impact of the Coronavirus outbreak, the policy decisions of central banks and government around the world, and potentially the health of the US stock market which looks to be extended at this time, but we'll look into the later in a subsequent post

Monday, February 4, 2013

S&P 500 Analysis: Valuation, Sentiment and Technicals - February 2013 Update

Last time I did this analysis was in January 2012, and I found out the US market was not particularly attractive with the S&P 500 just over 1,300, but not extended quite enough (AAII sentiment) to short it, the S&P 500 is now over 1,500, so let's update this long term analysis.

S&P 500 Valuation

The Shiller S&P 500 CAPE (10-year price earning ratio adjusted for inflation) is the reference to assess whether the S&P 500 is undervalued or overvalued over long periods of time. Here's what it looks like now:


The CAPE stands at 22.77 vs 21.14 over a year ago, so by this metric the S&P 500 is even more overvalued than last year. Although it's still much lower than the CAPE in 2000, it's still high compared to historical CAPE, and at the level of previous tops in the stock market (1901, 1929 and 1966).

Many analysts like to look at the short term, and show that forward PE ratio is only about 14, and use this number to explain stocks are a pretty good bargain right now. In 2007, we had the same rhetoric, as forward PE was low because of high corporate earnings, which were widely above their long term trend.
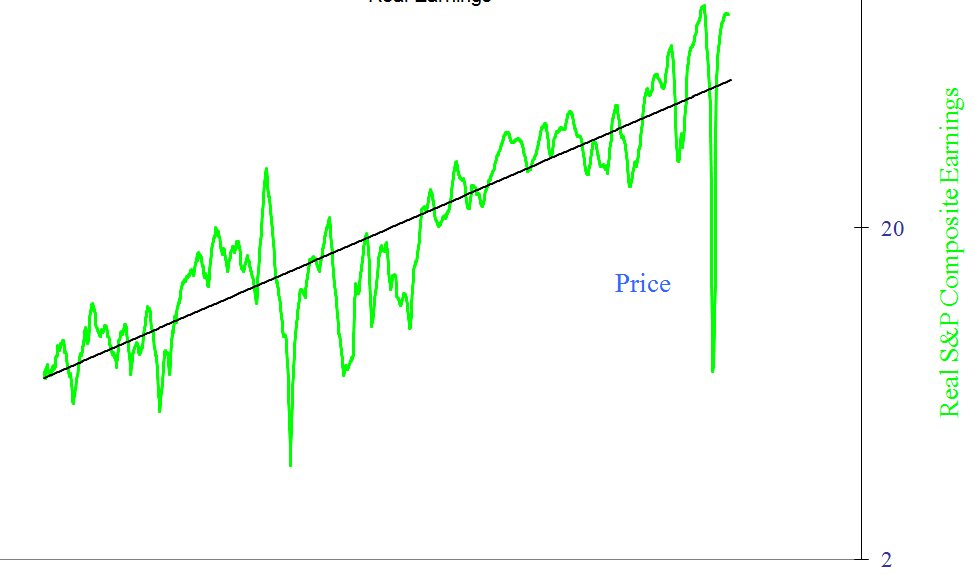
The chart above shows the S&P 500 earning adjust for inflation (real earning) between 1870 and today. We are clearly above trend, and this does not bode well for future returns.

Based on the 2 metrics above, the conclusion is the same as last year and it appears that based on valuation investing in the S&P 500 for the next several years might not be the best of ideas, or least it's rather risky.


US Market Investors Sentiment

Based on last week AAII sentiment survey, investors are moderately bullish for the next 6 months.
But I like to look at the 14-week moving average of the AAII sentiment survey (which I call AAII-14), since I found it to be useful to identify  some of the optimistic (and market) peaks of the past. The rule goes as follows: If the 14-week moving average of the AAII "Bullish" sentiment index is at 30% or below there could be a long term buying opportunity, above 50% there could be a long term sell opportunity.


Now this is getting interesting, as sentiment is pretty bullish, and AAII-14 getting closer to the 50% mark, even though it's not quite there for now.

S&P 500 Technicals

We are now going to have a look at some technical indicators namely RSI-14 and NYA200R, as well as draw trend lines on the S&P 500 to see what it might do in the short term.


The chart above (Yahoo Finance) is the 6 month chart of the S&P 500 with RSI-14, and we've been around 80 for a little while, which means the market is overbought in the short term.

NYA200R shows over 83% of stock are above their 200-day moving average, which is  not very bullish for stocks either
Now let's get back the S&P 500 chart, but this time over 5 years, and let's try to draw bottom and top parallel trend lines.


We seem to have reached the top of the trend started since 2010, so a correction (at least in the short term) could occur very soon.

Conclusion

In the short term, all indicators shown above are bearish since they all indicate the market is overbought, so it's prudent to own less US stock at the moment, and traders may also consider shorting for the next few weeks/months.

In the long term, the S&P 500 is overvalued by all measures, but market participant is not extreme just yet, so there could be a short term correction, followed by a rally before stocks head south for a longer period of times. Alternatively, it's also possible positive sentiment carries on the S&P 500 to new highs, and the long term reversal comes earlier than expected.

Saturday, January 28, 2012

US Markets Valuation, Sentiment and Technical Analysis - January 2012

In recent weeks, the S&P 500 has performed very well, almost reaching 2011 highs. At the same time, several indicators would seem to indicate a recession is coming to the US in 2012 and the Baltic dry Index does not look good either.

Today, I'm going to look at US markets, both in terms of valuation and sentiment. I will also look into technical factors to help determine whether it is a good time to sell or even short US markets.

S&P 500 Valuation.

For long term investors, Shiller S&P 500 CAPE (10-year price earning ratio adjusted for inflation) is the reference to assess whether the S&P 500 is undervalued or overvalued. Here's what it looks like today:

 The CAPE stands at 21.14, it's much lower than the CAPE in 2000 (That is when Shiller talked about "irrational exuberance"), but still high compared to historical CAPE (average is around 15-16).

Another way, I like to look at valuation is by looking at earnings only. Historically, they've had a tendency to increase at a fix rate over long period of time and always oscillate around the trend line. That's the "mean reversion" preached by Jeremy Grantham. Here's the logarithmic chart of S&P 500 inflation-adjusted earnings between 1870 and 2012.

In 2011, earnings are above average and will revert to the mean at some point. Of course this could be this year or in several years.

Based on the 2 metrics above, it seems that based on valuation it is rather risky to invest in the S&P 500 or at least it's likely to average disappointing returns.

US Market Investors Sentiment.

Previously I liked to follow Market Harmonics Bull/Bear ratio, but it is not a free service anymore since last April. Now, I use the AAII sentiment index instead:
 Week ending 1/25/2012

Bullish 48.4%
up 1.2
Neutral 32.7%
up 3.5
Bearish 18.9%
down 4.7


According the AAII, the long term average are as follows: Bullish: 39%,  Neutral: 31% and  Bearish: 30%.
That shows people are now pretty optimist about the future. As a contrarian, that would be a bearish sign.

However, I like to look at things in a longer term perspective using AAII-14, as explained in my post "Using AAII Sentiment Survey to Time the Market". If the 14-week moving average of the AAII "Bullish" sentiment index is at 30% or below is a long term buy, above 50% it is a long term sell.
Now the AAII-14 is at about 42%, so this is neutral.

S&P 500 Technicals.

I'm now going to look at my 2 favorites technical metrics the RSI-14 and the index showing the percentage of stocks above their 200-day moving average (NYA200R).


I use the 14-day relative strength index moving average for short term moves.


The S&P 500 6-month chart and RSI-14 chart (Source: Yahoo Finance) shows it is now at 76.20. On the 23rd of January the RSI-14 was at 87.57 which was overbought, so a short term correction should be expected.

The NYA200R is really the index which tell me "wait" when other indicators tell me to buy or sell. Here's what it looks like today. (Source: StockCharts.com)

At 65.10%, the NYA200R tells me there is probably more upside potential for the S&P 500. I would become wary of holding stocks if it reached 80% or more for several weeks/month.

Conclusion

As some indicators suggest, there are significant recession risks for 2012. The S&P 500 seems relatively overvalued compared to historical ratios. Short term investors are very bullish and the market is overbought. However, longer term, it appears we have to not reached extreme bullishness (as the AAII-14 implies) and the NYA200R would suggest stocks have still more upside.

Based on this analysis, I would personally not add any position at the moment because of valuation and short-term bullishness and would even consider decreasing exposure to US stocks. I would not short the market however, because not all indicators are extreme and we have mad men (e.g. Ben Bernanke) and women (e.g. Janet Yellen) at the head of the US federal reserve that could unleash QE3 after announcing zero interest rates until 2014 since week.