It was around 130& at the time, a level considered to represent an overvalued stock market, with 80% being fair-valued. As the stock market continued recovering, and the GDP "only" dropped by 4.8% in Q1 2020 for a total of 21.54 trillion dollars annualized, the ratio became slightly worse, and today it is at about 134%.

But once numbers for Q2 2020 come out, there will need to be adjustments. Either the stock market lowers to keep the ratio realistic, or it ignored the news, and the market cap to GDP goes to lalaland at levels never seen before... So what kind of scenario may happen? To find out we'll take the more recent Atlanta Fed GDPNow forecast for Q2 2020.

That would be a 42.8% drop (annualized). So If I understand correctly, we'd take the 21.54 trillion dollars mentioned in the introduction, and deduct 42.8% for it. Total: 12.32 trillion dollars or about the same amount of 2004 GDP.

What would that do to the US market cap to GDP ratio, if stocks were to stay at the current levels? We already have the estimated GDP (12.32 trillion), so we need the Wilshire 5000 market cap that is 28.77 trillion (courtesy of Ycharts).
That a cool ratio of 233% market cap to GDP... Let's represent this on a chart...
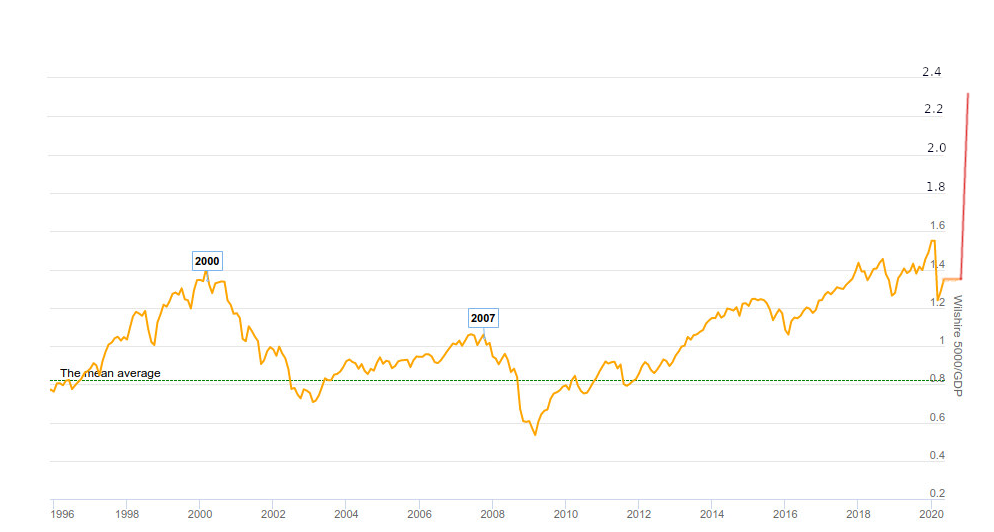
Beautiful! Although it's temporary, as it will come down as GDP eventually increases significantly once economies reopen.
Let's look at scenario two, where stocks magically adjust to the new GDP number. That one may not be quite realistic because markets are supposed to adjust themselves to future outcomes, although the markets have not been very good at it. But anyway, a 134% ratio would mean the Wilshire 5000 would drop from 28.77 trillion to 16.50 trillion, or a 42.6% drop.
Since most people don't follow the Wilshire 500, let's apply the 42.6% drop to the S&P 500 index at 2,863.70 points on May 15. That would make it drop to 1,643 points.

Q2 2020 GDP first official estimate is supposed to be released in July 2020, hence the strange shape of our chart. Note at 134% TCM to GDP, the stock market would be vastly overvalued if we ignore future GDP growth.
But let's take a more realistic scenario that assumes the Federal Reserve does not completely go crazy with the money supply. We would get back to 18 trillion GDP, with a fairly valued stock market (and fairly pessimistic investor sentiment) at 80% of GDP. In this case, the Wilshire 5000 would have a market capitalization of 14.4 trillion dollars. That's even lower than our case above but spread over a longer period of time. Where would be the S&P 500 then, let's say in H1 2021? That's roughly a 50% drop, meaning the S&P 500 would be around 1,430 points, the Dow Jones under 12,000. I think you get the point, no chart needed...
Happy investing, and good luck!
I would like to know when you discovered when the folks who set up the clone of Brookfield Investment Funds PLC was a scam, as I am on the victims of the scam and fell victim to its money mule -Kaloca Inc. I can be reached via jm8257@gmail.com - Joel
ReplyDelete