It's been a very long time since I have done an S&P 500 analysis with valuation, sentiment and technical indicators taken into account. So let's get an updated picture for June 2020.
S&P 500 Valuation
One way to look at value is to check out the CAPE 10 ratio (Cyclically Adjusted
Price Earnings Ratio over a 10-year period). It now stands at close to 30, and that's before "COVID-19" earnings are released.
Price Earnings Ratio over a 10-year period). It now stands at close to 30, and that's before "COVID-19" earnings are released.
That's historically very elevated and similar to the 1929 stock market bubble. Expect the number to shoot with earning announcements if the stock market does not correct first.
Corporate earnings tend to revert to the mean over time.
It's a lagging indicator, as Q2 earnings have not been announced just yet. But the chart shows earnings were way above the historical trend before the crisis. July will be interested as earnings announcement will mean this number possibly goes negative.
AAII Sentiment
The stock market is all about people's feelings, and AAII members are not buying the rally, as they have still 48.9% bearish.
The AAII sentiment survey used to be a contrarian indicator, but I'm not sure it's still the case. This would mean stocks have further gains, but in this case I suppose AAII investor believe the market will go down in the next six months, and did not really participate in the rally..
Technical Indicators
The RSI-14 (14-day relative strength index) can help us find out if a market is oversold or overbought.
The RSI-14 is now at 54 or close to neutral. This compares to close to 80 in January/February when markets were clearly overbought in the short term.
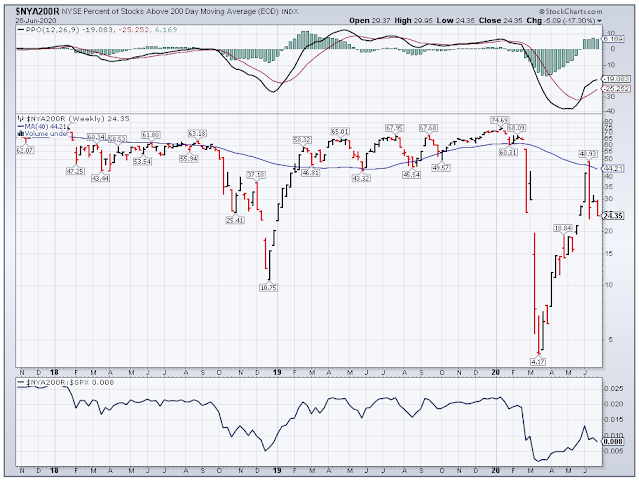
The NYA200R (percentage of stocks over their 200-day moving average) can be used to determine if only a few stocks participated in a rally.
The current chart shows only about 25% of stocks are above their 200-day moving average meaning the elevated S&P 500 stock market level may be due to some larger capitalization, while smaller stocks are still suffering, or not participating in the rally just as much.
Conclusion
Apart from the US stock market valuation metrics to which we could add the stock market to GDP ratio, we are not really at extremes while looking at sentiment and technical indicators. So I would be very wary of going long, but at the same time the rally may not be over. Another important metrics for investors in 2020 will also be the Federal Reserve assets purchases, but it's pretty hard to forecast what a small group of people will do, especially during a presidential election year.


No comments:
Post a Comment