Thursday, March 29, 2012

Eric Sprott: The Recovery Has No Clothes

Sprott Asset Management published their monthly newsletter Market at Glance (March 2012) entitled "The [Recovery] Has No Clothes".

Eric Sprott and David Baker explain that although Greece has been papered over, and many people are now bullish, very little has actually changed for the better, and it's too early to declare a new bull market has started.

Among all the cheer-leading with "good" indicators, they give some counter examples of not so good indicators:
  1. Although the BLS announced an unemployment rate of 8.3%, the Gallup survey showed unemployment increasing to 9.1% in February (8.6% after seasonal adjustments) versus 8.6% in January.
  2. US food stamp participation has reached an all-time record of 46,514,238 in December 2011, up 227,922.
  3. Europe's 9.7% year-over-year decrease in auto sales
  4. 100bp drop in the March consumer confidence index
  5. 5 consecutive months of manufacturing contraction in China
  6. 0.9% drop in US February existing home sales.
  7. In February 2012, the Treasury reported $103.4 billion in tax receipts, versus $110.6 billion in February 2011.
They also commented on the Federal Reserve stress test on large US banks:

The test used an almost apocalyptic hypothetical 2013 scenario defined by 13% unemployment, a 50% decline in stock prices and a further 21% decline in US home prices. The stress tests tested where major US banks' Tier 1 capital would be if such a scenario came to pass. Anyone who still had 5% Tier 1 capital and above was safe, anyone below would fail. So essentially, in a scenario where the stock market is cut in half, any bank who had 5 cents supporting their "dollar" worth of assets (which are not marked-to-market and therefore likely not worth anywhere close to $1), would somehow survive an otherwise miserable financial environment. The market clearly doesn't see the ridiculousness of such a test, and the meaninglessness of having 5 cents of capital support $1 of assets in an environment where that $1 is likely to be almost completely illiquid.
They also mentioned that Dexia, a Belgian bank, passed the European stress test, only to fail 3 months later.

Then Eric Sprott and David Baker turned to their specialty: Precious metals.
Our skepticism would be supported if not for one thing - the recent weakness in gold and silver prices. Given our view of the market, the recent sell-offs have not made sense given the considerable central bank intervention we highlighted in February.
After the good performance of Gold and Silver in January and February, both markets were hammered on the 29th of February, as Ben Bernanke gave a speech (QE3 not needed) and the European central bank flooded the market with another €529.5 billion with the second part of Long-Term Refinancing Operation (LTRO).

QE3 is not off the table, just delayed, and Gold and Silver price drop was exclusively due to a sell-off on the paper market with the equivalent of 173 million ounces of physical silver exchanged between 10:30 am and 11:30 am. Compared that to the yearly production of Silver (730 million ounces), almost 24% yearly silver production exchanged in 1 hour.

An analysis of the paper-silver market shows that Silver is  traded 143 times higher in the paper markets versus what is produced by mine supply compare that to crude oil (14.3 X), Aluminum (46.8 X), Gold (69.4 X) and Copper (75.1 X) and they conclude:

The prevalence of paper trading in the silver market is what makes the drastic price declines possible by allowing non-physical holders to sell massive size into a relatively small market. It's not as if real owners of 160 million ounces of physical silver dumped it on the market on February 29th, and yet the futures market allows the silver spot price to respond as if they had.
The Gold market also looked suspicious with $3 billion of physical gold dumped into the market in a short time, and this was probably not done by speculators or investors.

They conclude as follows:

If we are right about gold and silver as currencies, and if they we are right about the continuation of central bank printing, both gold and silver will continue to appreciate in various fiat currencies over time. If there is indeed some sort of manipulation in the futures market that is designed to suppress the prices for both metals so as to detract from the mainstream investor's interest in them as alternative currencies, then both metals are likely trading at suppressed prices today.

...

The equity market rally that began in late December appears to be generated more by excess government-induced liquidity than it does by any raw fundamentals. We continue to scour the data for signs of a true recovery and we are simply not seeing it.

...
We would also expect the precious metals complex to enjoy renewed strength as the year continues. One bad month does not change a long-term trend that has been building over 10 years. Gold and silver will both have an important role to play as the central bank-induced printing continues, and we expect more on that front in short order.
The full version of the newsletters is available at http://sprott.com/markets-at-a-glance/the-%5Brecovery%5D-has-no-clothes/

Monday, March 26, 2012

Peter Schiff: Ben Bernanke is Public Enemy No. 1

Peter Schiff is interviewed on CNBC Fast Money on the 26th of March 2012 and explains the Federal Reserve is now blowing a massive bubble in US treasury and government debt and once this pops (as interest rate must be increased due to inflation), banks will fail and the crisis will be worse than 2008/2009.

Friday, March 23, 2012

Jim Rogers on Crude Oil, Gold, Silver and Agriculture Commodities

Lots of media appearance by Jim Rogers this week. Here's an awesome interview by VisionVictory, where they discuss crude oil, precious metals, commodities, the future of the US dollar and potential civil unrests.

Jim Rogers: Buy Chinese Shares & Gold on Pullbacks

American investor Jim Rogers in Madrid (Spain)...

Jim Rogers interview on CNBC Fast Money on the 23rd of March 2012.

He said he hoped that the Chinese market collapses so he can buy (more) Chinese shares and sees a global slowdown within 1 or 2 years. He also said the would buy more and more Gold as the price falls. He would buy Gold very aggressively would it fall to the 1200-1300 USD range. He's also short US treasuries even if he admits it has not worked so well to date.

Tuesday, March 20, 2012

Mike Maloney Interviews Jim Rogers

Mike Maloney, of goldsilver.com, interviews Jim Rogers on the 20th of March 2012. They discuss about  about markets, Bernanke, the East/West Cycle and more...

Sunday, March 18, 2012

Marc Faber: Beware of The Unintended Consequences Of Money Printing

Interview with Marc Faber and Chris Martenson (March 16,2012) about the unintended consequences of money printing by central banks.

First they discuss about the Greek default which does not matter according to Marc Faber, then they focus on central banks, the fact that they will never reduce their balance sheets as they have embarked on the path of money printing, and how the lower purchasing power of money particularly affects low and middle income people.

When Chris Martenson mentions the high price of oil, Marc Faber explains that consumers of Oil (mainly western economies) are suffering, but producers (Russia,. Saudi Arabia...) are benefiting.

Finally, they talk about Gold and Silver. Everybody should own precious metals as an insurance policy against a financial meltdown. Gold is not particularly expensive according to Marc Faber, although he still think we are in a correction phase. Having said that he won't sell his Gold as long as Obama (or a republican) is in power because they won't address the problems.
Marc Faber eventually sees the full financial system become an MF Global (he said some people got all their money whereas some didn't) and for that reason you should keep your Gold in a safe deposit, not in the US, but rather at some airports such as Singapore.

Saturday, March 17, 2012

Jim Grant: How About Capitalism, Ben Bernanke ?

James Grant is interviewed on Bloomberg and the 13th of March 2012 after the federal reserve meeting.

He first talks about the Federal Reserve monetary policy and the bond market.

He explains that by distorting interest rates, the Federal reserve has suppressed price mechanisms and with little value in bonds (he calls the bond market a "desert of value"), many people flock to high yielding junk bonds.

JACKSONVILLE, FL - NOVEMBER 5:  Federal Reserv...
Ben Bernanke
He also "translates" terms of Bernanke speech:
  • Highly accomodative = high manipulative
  • Quantitative easing = money printing
He explains that Gold price is a function of the action of central banks and note that the ECB has increased its balance sheet by an astounding 89% on an annual basis, the British central bank by 67% and the fed by only 15%. All those numbers are unprecedented and the way they do it is by simply taping numbers on a computer screen.

Jim Grant also took a stab at Warrent Buffet's "Stocks outperform Gold" by showing a chart between 1996 and today with the prices of Gold, sugar and Coca-Cola stock. During that period Gold was the best performer, followed by sugar and then Coca-cola. He explains that valuation is important. Whereas Coca-cola had a PE ratio of 39 in 1996, it now has a much better 16 PE ratio. He also mentioned that while Gold is now the refuge of the fearful, back in 1996, Gold was considered to be the refuge of the idiots. :)

Finally he says he's bearish on the Chinese economy and worries about the consequence of a Chinese slump, since many people think the Chinese have found the formula to make it work...

The Next 20 Years: Inflation vs Deflation

Steve Keen, an Australian economist and contrarian strongly opposed to neo-classic economists views, has recently posted an article entitled "Economics without a blind-spot on debt" where he discusses the importance of private debt during the great depression and now.

He managed to gather the data for aggregate private debt in the US and Australia and drew the result in the chart below:
There was a debt bubble in the 30s which led to the great depression, and now it appears we have the same kind of bubble, only more pronounced. The main difference is that now we live in a world of fiat currencies and what happens next is highly depending on monetary policies.

I encourage you to read his blog post for details about private debt. I'm going to focus on 2 scenarios:
  • Deflation where the central banks do not really fight the debt deflation (or debtflation).
  • Inflation where the central banks decide to keep the aggregate private debt constant and works thru the years via inflation.
If we consider 150% of GDP to be a normal level of aggregate private debt then the debt bubble started around 1987 and peaked in 2010 (a 23-year debt increase). Historically, bubbles have a tendency to be somewhat symmetric, so in the case of debt deflation let's assume it to last 23 years that is until 2033, or about 20 years from now.

In this scenario, there would be massive deflation, and, in theory, the preferred asset would be cash (under the mattress) and many companies and banks would have to go bankrupt, but in reality, the system would probably have to collapse, and I'm not so sure what the value of cash would be. This is the kind of scenario envisioned by Robert Prechter who sees the Dow Jones at 1000 USD.

The other scenario (flat private debt to GDP ratio) would assume massive money printing. Let's assume somehow the federal reserve can keep this ratio constant by printing money during 23 years. If the GDP growth is flat, it would require about 3% (extra) inflation per year. However, during that period, there is actually a good chance of negative growth because Peak oil consequences will be in full effect unless we find some energy alternatives. This also excludes public debt and unfunded liabilities (about 100 trillions USD or 600% of GDP) which would require inflation north of 10% to get monetized.

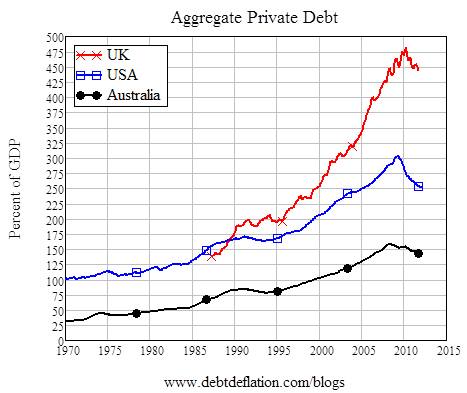
If you think the US is in bad shape, just look at the aggregate private debt in the UK in the chart below. This country (and the British pound) are going to have a very rough time in the years and even decades ahead, as its private debt stands at 450% of GDP.
You may also want to read "Currency Crisis:Why is the British Pound a doomed currency ?" for a more detailed analysis of the United Kingdom debt and upcoming GBP currency crisis.

Thursday, March 15, 2012

GMO 7-Year Asset Class Forecasts - February 2012

GMO has just released its quarterly 7-year Asset Class Forecasts and here are the expected annualized return (based on valuation and historical earning growth):

  • US Large caps: 0.4% per year
  • US Small caps: -1.8% per year
  • US High Quality: 4.4% per year
  • International Large caps: 4.0% per year
  • International Small caps: 3.3% per year
  • Emerging Markets: 5.0% per year

Different kinds of bonds are expected to return between -2.5% and 0.8% per year.
Managed Timber is expected to return 6.5% per year. Those are real returns adjusted for inflation of 2.5% per year.

Those returns look lackluster, and the chart above is as of 29th of February 2012. The different market have generally rallied since then, so the expect returns over 7-year should even be lower today.

Over the next 7 years, the best performing assets are expected to be emerging markets and US high quality stocks and the worst performing assets should be US and international bonds. The US market (except High Quality Stocks) should also be avoided with returns between -1.8% and 0.4% per year.

The ways to act on this forecast is to buy iShares MSCI BRIC Index (BKF) on the long side (I'm not sure how you could get exposure to high quality stocks as defined by GMO), and buy short ETF for bonds such as ProShares Short 20+ Year Treasuries (TBF). If you can short, you could do so with SPDR Barclays Capital International Treasury Bonds (BWX). However, the expected returns on the short side, may not warrant taking this risk just yet, especially with the decay inherent to short and leveraged ETFs.

You can receive GMO's forecasts (monthly) and the quarterly newsletter for free by registering at http://www.gmo.com

GEAB 63: Global Systemic Crisis: The 5 Devastating Storms of Summer 2012 at the Heart of the Global Geopolitical Dislocation

Here are the highlights of GEAB 63 (March 2012) entitled "Global Systemic Crisis: The 5 devastating storms of summer 2012 at the heart of global geopolitical dislocation":
  • Global Systemic Crisis: The five devastating storms of summer 2012 at the heart of the global geopolitical dislocationGlobal recession, debt crises, stock market crashes, potential war with Iran.
  • Summer 2012: The US falls back into recession as Europe stagnates and BRICs slow down. LEAP 2012 predicts a global recession in 2012.
  • Summer 2012: Central banks roadblocks and the rise of interest rates. The US federal reserve must now manage two new problems: the lack of demand for US treasuries and the rise of two other currencies: the Euro and the Chinese yuan.
  • Summer 2012: Storm on currency markets and western public debts. After several attempts to stabilize exchange rates over the last few quarters, the failure to come to an agreement for a new currency at the G20 in order to build a new monetary system will lead to more currency volatility and further debt crises in western economies.
  • Summer 2012: Iran, the war "too many". Whether this war occurs or not, it will be the war too many for the western world.
  • Summer 2012: The new stock market and financial institutions crash. Iran's allies, such as China, are likely to hurt Washington financially by diversifying US dollar assets into other currencies.by announcing with Moscow that they will stop buying US treasuries in order to stop the US war machine.
  • 2015: "The great fall of western real estate" - Excerpt of the chapter on the evolution of US residential real estate. As the US manufactures less and less, the country will become poorer and accelerated the fall of American real estate.
  • Strategic and operational recommendations. Consequence of the emergence of 3 main monetary zones (US Europe and China). Inflection point for Gold. Commodities: conflict vs recession. End of the illusion for the US economy. Orange alert (whatever that means) on financial products..
  • The GlobalEurometre - Results & Analyses. 85% of respondents think of European governance is being put into place.
The full GEAB 63 (PDF format) is available to LEAP 2020 subscribers for 200 Euros per year (10 + 6 issues).

Wednesday, March 7, 2012

Silver and Gold Next Buying Opportunity: $25 and $1500

All markets have started to correct including Gold and Silver. Let's see if we can analyze trends to find entry points for the precious metals. I should note that If you have little exposure, any time is a good time to buy physical Gold and Silver simply to protect yourself against financial apocalypse, even if the possibility is remote. Simply view it as an insurance and one where you are likely to get your premium back !

First, let's have a look at Silver which have been correcting since April 2011 after nearly hitting 50 USD. (Charts: Boursorama.com)

We can clearly see a descending channel since April 2011 and if the trends continue, we should see Silver close to 25 USD where it should be another good time to aggressively add to your positions. Now let's see a longer perspective with a 15-year logarithmic chart.
The long term trend is clearly on the upside and the interesting is that the lower line of the channel is around 25 USD. That means that if you believe in the long term fundamentals of Silver (central banks will have to monetize debt, shortages etc...), you should really be an aggressive buyer below 26 USD.

Now let's have a look at Gold with a chart between October 2010 and March 2012 which shows Gold peaked in September 2011 and have been correcting since. If the trend continue we could reach about 1500 USD.

If we look at the long term chart, here again there is a clear uptrend channel with the lower line just below 1500 USD and it would again be a tremendous buying opportunity like in October 2008 or August 2005.
To conclude based on the trends mentioned above, we could be close to a multi-year buying opportunity for both Gold and Silver. There is no way to tell for sure, but if the chart continues their trend, those opportunities should occur in April or May 2012. There is always the Iran war scenario (where precious metals would just go ballistic), but I very much doubt that Obama would go to war against Iran before the presidential elections in November 2012.

Thursday, March 1, 2012

Peter Schiff Launches a US Equity Fund (EPUSX)

English: Portrait of Peter Schiff taken from t...
Image via Wikipedia
Euro Pacific Asset Management, affiliated with Peter Schiff's Euro Pacific Capital,has announced the launch of the EP Strategic US Equity Fund (EPUSX).

The EP Strategic US Equity Fund aims to provide capital appreciation and income over a long-term investment horizon by primarily investing in US-domiciled companies that the fund managers believe may benefit from increasing international sales in overseas markets in order to protect investors against the depreciation of the US dollar. 

Here's the rest of the press release:
 
The Fund is overseen by Peter Schiff, investment committee chairperson, and managed by Jim Nelson, CFA; the same team that oversees Euro Pacific Asset Management's other fund offerings. Patrick Rien, CFA, will serve as co-manager of the Fund. The Fund is designed for US-based investors who would like get exposure to US equity markets by owning a basket of American companies that derive a majority of their earnings from overseas. It is expected that such companies will benefit from an environment of US dollar weakness.  

"Many American investors believe strongly that global economic conditions will continue to push up key foreign markets at a faster growth trajectory than what will likely be seen in the United States" said Peter Schiff. "At the same time, many of these investors want, or in some cases need, to maintain exposure to the US equity market. We hope to bridge this gap by offering a fund that holds US companies that derive a majority of their earnings abroad."  

The Fund's portfolio management team will use a top-down approach to target attractive markets abroad, and a bottom-up approach to select US companies with the best fundamentals that have exposure to those markets. The team will favor markets that have shown a willingness to allow their currencies to strengthen against the US dollar, and that have high expected GDP growth, positive real interest rates, a sustainable current account surplus, and low levels of private and public debt. Additionally, the team will focus on companies that may benefit from country-specific trends such as growth in consumer spending, increasing foreign investment, or plentiful access to natural resources.  

"In an environment where the Dollar is weakening, it is of critical importance for investors to understand that some US companies are likely to perform better than others," said Jim Nelson. "With the EP Strategic US Equity Fund, an investor can own US businesses with overseas exposure to what we believe are the most attractive markets, while minimizing ownership of those firms focused solely on the spending habits of US consumers."