Monday, February 18, 2013

Gold - Long Term Chart Says Buy Now!

Since 2001, Gold has been behaving very nicely and stayed in a narrow range in its logarithmic chart. So If Gold has gone down for an extended period of time and suddenly drop at level not seen for a while, or alternatively if it has gone up for a long time, and makes new highs, I like to have a look at the logarithmic chart since the bull market started in 2001, and see is we've hit the higher or lower bound of the trend
(Source: Boursorama)
Guess what, we've just hit the lower bound last Friday. Assuming long term fundamentals remain the same (debt issue, money printing...), Gold is likely to go up over time, and this could prove to be the right time to buy. The 14-day RSI is at 30 (and hit this level 3 times) which means Gold is oversold short term. So it looks like a long and short term buy at this level.

The only thing that bothers me is that is has mostly corrected through time, and not really through price (it only lost 15%) which means it keep it amazing record of 12 positive years. Which is probably why Georges Soros recently lightened his position, and Jim Rogers said he would not buy at those levels. however, Marc Faber still continues to advice buying every month.

The Gold chart may also indicate it's a good time to buy Silver which has gone down by over 40% since the $50 it hit in 2011, but it's still not technically oversold (yet).

Monday, February 4, 2013

S&P 500 Analysis: Valuation, Sentiment and Technicals - February 2013 Update

Last time I did this analysis was in January 2012, and I found out the US market was not particularly attractive with the S&P 500 just over 1,300, but not extended quite enough (AAII sentiment) to short it, the S&P 500 is now over 1,500, so let's update this long term analysis.

S&P 500 Valuation

The Shiller S&P 500 CAPE (10-year price earning ratio adjusted for inflation) is the reference to assess whether the S&P 500 is undervalued or overvalued over long periods of time. Here's what it looks like now:


The CAPE stands at 22.77 vs 21.14 over a year ago, so by this metric the S&P 500 is even more overvalued than last year. Although it's still much lower than the CAPE in 2000, it's still high compared to historical CAPE, and at the level of previous tops in the stock market (1901, 1929 and 1966).

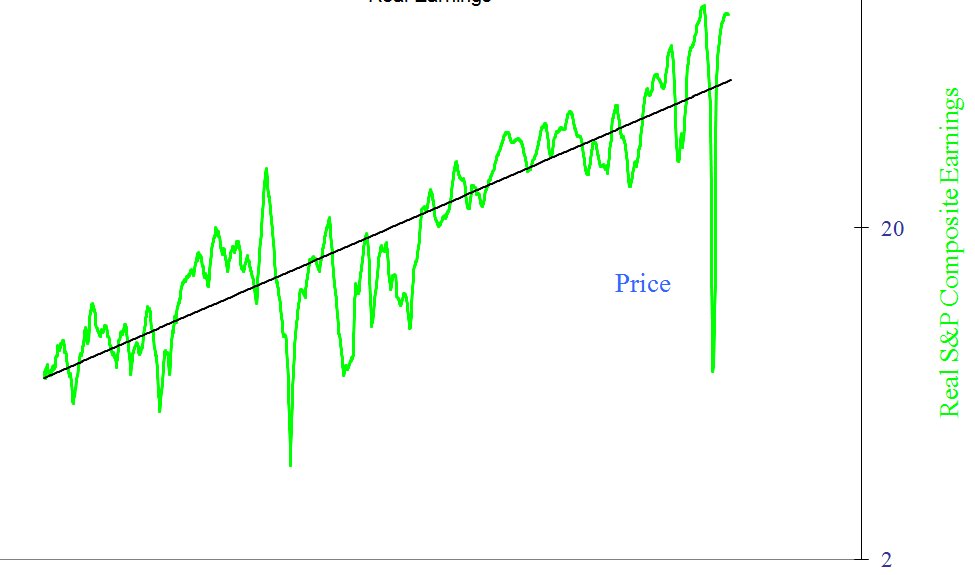
Many analysts like to look at the short term, and show that forward PE ratio is only about 14, and use this number to explain stocks are a pretty good bargain right now. In 2007, we had the same rhetoric, as forward PE was low because of high corporate earnings, which were widely above their long term trend.
The chart above shows the S&P 500 earning adjust for inflation (real earning) between 1870 and today. We are clearly above trend, and this does not bode well for future returns.

Based on the 2 metrics above, the conclusion is the same as last year and it appears that based on valuation investing in the S&P 500 for the next several years might not be the best of ideas, or least it's rather risky.


US Market Investors Sentiment

Based on last week AAII sentiment survey, investors are moderately bullish for the next 6 months.
But I like to look at the 14-week moving average of the AAII sentiment survey (which I call AAII-14), since I found it to be useful to identify  some of the optimistic (and market) peaks of the past. The rule goes as follows: If the 14-week moving average of the AAII "Bullish" sentiment index is at 30% or below there could be a long term buying opportunity, above 50% there could be a long term sell opportunity.


Now this is getting interesting, as sentiment is pretty bullish, and AAII-14 getting closer to the 50% mark, even though it's not quite there for now.

S&P 500 Technicals

We are now going to have a look at some technical indicators namely RSI-14 and NYA200R, as well as draw trend lines on the S&P 500 to see what it might do in the short term.


The chart above (Yahoo Finance) is the 6 month chart of the S&P 500 with RSI-14, and we've been around 80 for a little while, which means the market is overbought in the short term.

NYA200R shows over 83% of stock are above their 200-day moving average, which is  not very bullish for stocks either
Now let's get back the S&P 500 chart, but this time over 5 years, and let's try to draw bottom and top parallel trend lines.


We seem to have reached the top of the trend started since 2010, so a correction (at least in the short term) could occur very soon.

Conclusion

In the short term, all indicators shown above are bearish since they all indicate the market is overbought, so it's prudent to own less US stock at the moment, and traders may also consider shorting for the next few weeks/months.

In the long term, the S&P 500 is overvalued by all measures, but market participant is not extreme just yet, so there could be a short term correction, followed by a rally before stocks head south for a longer period of times. Alternatively, it's also possible positive sentiment carries on the S&P 500 to new highs, and the long term reversal comes earlier than expected.

Saturday, February 2, 2013

Marc Faber February 2013 Market Commentary

Marc Faber has just released the market commentary for February 2013 entitled "A good Life is not a State to arrive at - but a Way of Traveling" on gloomboomdoom.com.

Marc Faber first explains that investors should learn to relax and ignore what markets do in the short term in order to outperform. He takes one of his reader question as example:

"Why I would rather not sell my gold and subsequently buy it back at a lower price.?" 

The reason he is not selling his gold is because he wants to diversify and keep approximately 25% of his assets in gold (also 25% in equities, 25% in corporate bonds and cash, and 25% in real estate). That way if the price of gold declines, it is likely that the value of his financial assets would increase, so a decline in the price of precious metals would actually be beneficial to the overall value of his assets since he has around  50% of his portfolio in bonds, cash and equities. But now that stocks and bonds have both rallied very strongly, he feels much more comfortable holding gold than financial assets.

There is no attachment with this month MMC.

If you want to access the full Monthly Market Commentary (MMC) by Marc Faber, it is available for 300 USD per year.  

Thursday, January 31, 2013

5 Typical Mistakes with Gold Investments

Axel Merk has published a new whitepaper entitled "Fools Gold: Five
Common Mistakes with Gold Investment" that deals with poor Gold investments decision or understanding.

5 investment advices are summarized below:
  1. Gold Stocks Ain’t Gold - Gold mining stocks, on aggregate, have significantly underperformed the price of gold.
  2.  There is Only One Real Thing - Other precious metals, including silver, may not perform as well as gold in times of economic duress.
  3. Beware of Premium Over Spot - Make a note of the spot price of gold per Troy ounce, so that you can calculate the premium the dealer is asking for (be sure to include any delivery, administrative, insurance, or related fees) before making a final decision
  4. Don’t Overlook the Expenses - Before you buy physical gold, you have to carefully consider the related storage and insurance costs.
  5. Make Sure Gold is Really There -  If you buy a Gold ETF make sure to read the prospetus, and be wary of large amount of "unallocated gold", and the ability to lease gold.

The full report is available for download on Merk Funds website.

Monday, January 21, 2013

Long Term Charts Thai Stock Market - January 2013 Update

This is a repost of the article found on CNX Translation forums.

6 months have gone since our last update, and its time again to update the long term charts of the Thai stock market.

The first chart is the SET index between 1975 and January 2013. Following other indices around the world, and despite my overvaluation view 6 months ago, the Thai stock market has continued its (unstoppable) rise in the last 6 months, and now stands at about 1440, a rise of about 40% since I started to become cautious.

Image

The PER is now around 18, mainly due to the stock market improvement. At 15, I started to be bearish, so at 18 it's extremely unusual for the Thai stock market. So either earnings have to go up substantially, either the stock market has to plunge, or a combination of the two.
Image

The price to book value slowly crept up to 2.4 which also starts to make Thai stocks overvalued, especially compared to what you get in other markets around the world. (European stocks have a P/B ratio around 1 now)
Image

To conclude, I believe the Thai stock market is relatively overvalued both historically, and compared to other stocks markets around the world. The dividend yield is now around 3% which is is that more than can get in a fixed deposit (Bangkok Bank now offers up to 2.65 % p.a for a 36 months fixed deposit), so why take the risk? There is also a lot of optimism around the world, which IMHO is not warranted, so I would not be surprised to see a massive correction in the Thai stock market within the next year.

Wednesday, January 2, 2013

Marc Faber January 2013 Market Commentary

Marc Faber has just released his January 2013 market commentary entitled "A Great Attitude Creates a Happy Future" on gloomboomdoom.com.

This month, Marc Faber discusses about what may constitutes the best investment: Education of one's children in the greater sense of the word including morality, generosity,. From one investor perspective, the best returns are achieved with "boring" stocks with lower volatility., and the very best way to even lower volatility further is to hold a diversified portfolio of different assets: properties, equities, bonds, precious metals, and cash.

The monthly market commentary including one attachment:

  • “It’s time to ‘Bet the Farm’ on farming and farmland” by Coast Sullenger. founder of GAIA Capital Advisors.
I could not find the report online, but GAIA capital advisors provides GAIA farming index and GAIA/ EFG Tracker Certificate.

If you want to access the full Monthly Market Commentary (MMC) by Marc Faber, it is available for 300 USD per year

Tuesday, December 25, 2012

Eric Sprott: Smart Investors Are Flocking to Silver


Sprott Asset Management published their monthly newsletter Market at Glance (December 2012) entitled "Why are (Smart) Investors Buying 50 Times More Physical Silver than Gold?"

Eric Sprott explains that demand for Silver relative to Gold has dramatically changed since 2008. The table below shows the US Mint gold and silver sales in ounces over the last few years:


Each year there's about 130 million Gold ounces and 1 Billion Silver ounces available per year, but due to use for industrial applications, the annual availability for investment purpose is respectively 120 million and 350 million ounces. Therefore, the ratio of physical silver availability to gold availability is roughly 3:1.

Investors are choosing to buy silver at a ratio to gold that is well above what is available. The silver price is currently mainly set in the paper market where the daily average trade on the Comex is approximately 300 million ounces. An outrageous number when you compare it to the daily mine production of about 2 million ounces, and the current price is most probably where it is because of market manipulation.

Sprott believes the current investment trend into silver is likely to continue.

The full version of the newsletters is available at http://sprottasset.com/markets-at-a-glance/why-are-%28smart%29-investors-buying-50-times-more-physical-silver-than-gold/